Pop-up statistics are performance metrics and real-time logs within Positive User that show you exactly how people interact with the messages on your website. Located inside the "Pop-ups" section under "Website Experience", this data tracks how many times your forms appear, how many contacts click or fill them out, and who those individuals are.
Measuring your pop-up statistics helps your marketing team move from guessing to knowing what catches your audience's attention. Instead of wondering if a discount offer or newsletter sign-up is working, you can see real-time data on conversion rates, tracking exactly where you are successfully capturing leads and where you might need to adjust your messaging.
Improve lead generation: See which offers convert best so you can design more effective signup forms.
Understand audience engagement: Track how many people see your messages compared to how many take action, giving you a clear picture of what resonates.
Refine your website messaging: Identify low-performing forms quickly so your team can test new headlines or designs without wasting traffic.
Equip sales and support teams: Gather immediate data from form submissions so your team can follow up with interested prospects right away.
Positive User collects interaction data automatically whenever a pop-up appears on your website. This tracking is split into two areas to give you both high-level trends and deep individual insights.
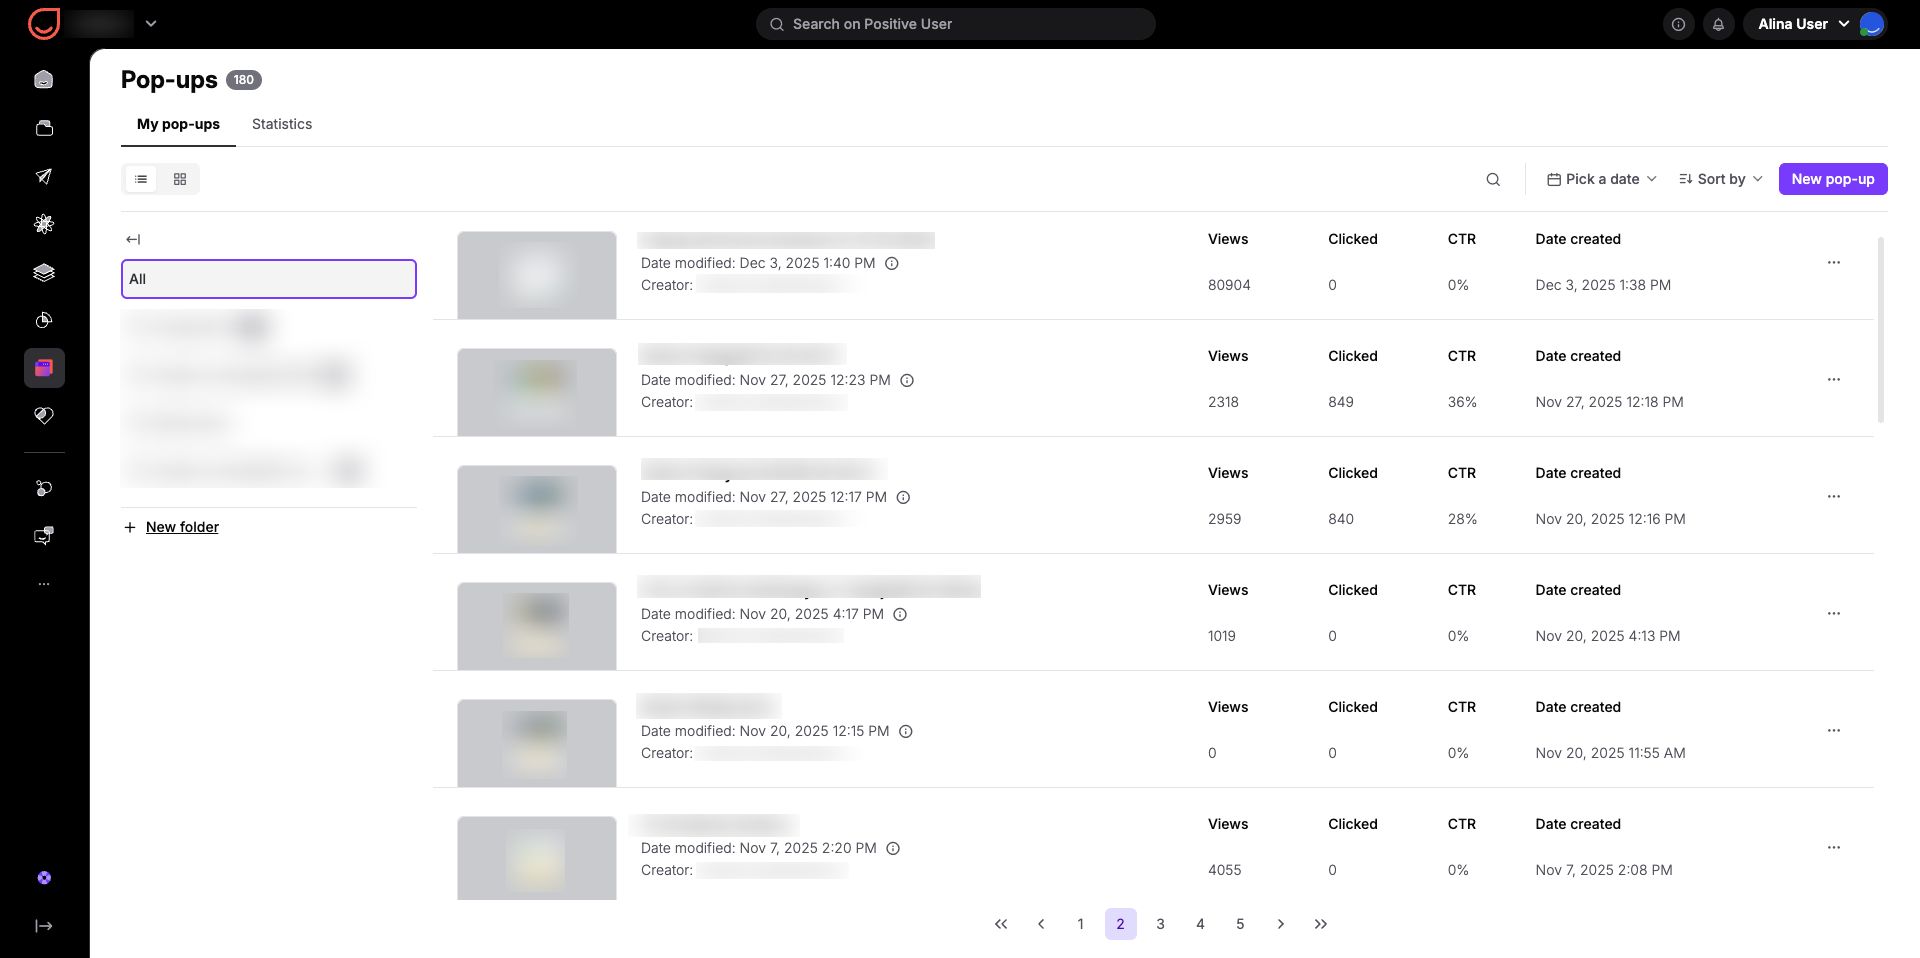
When you open the "Website Experience" section and go to "Pop-ups", you will find the "My pop-ups" tab. This tab lists every form you have created alongside key performance columns:
Views: The total number of times the message appeared to someone browsing your site.
Clicked: How many times a contact filled out an input form or clicked a redirect link.
CTR: The Click-Through Rate shows the percentage of views that turned into clicks or submissions.
To manage a large list, you can click "Pick a date" to filter data by a specific time frame, helping you isolate seasonal trends or campaign periods. You can also click "Sort by" to arrange your list by attributes like "Name" or "Creator" in ascending or descending order.
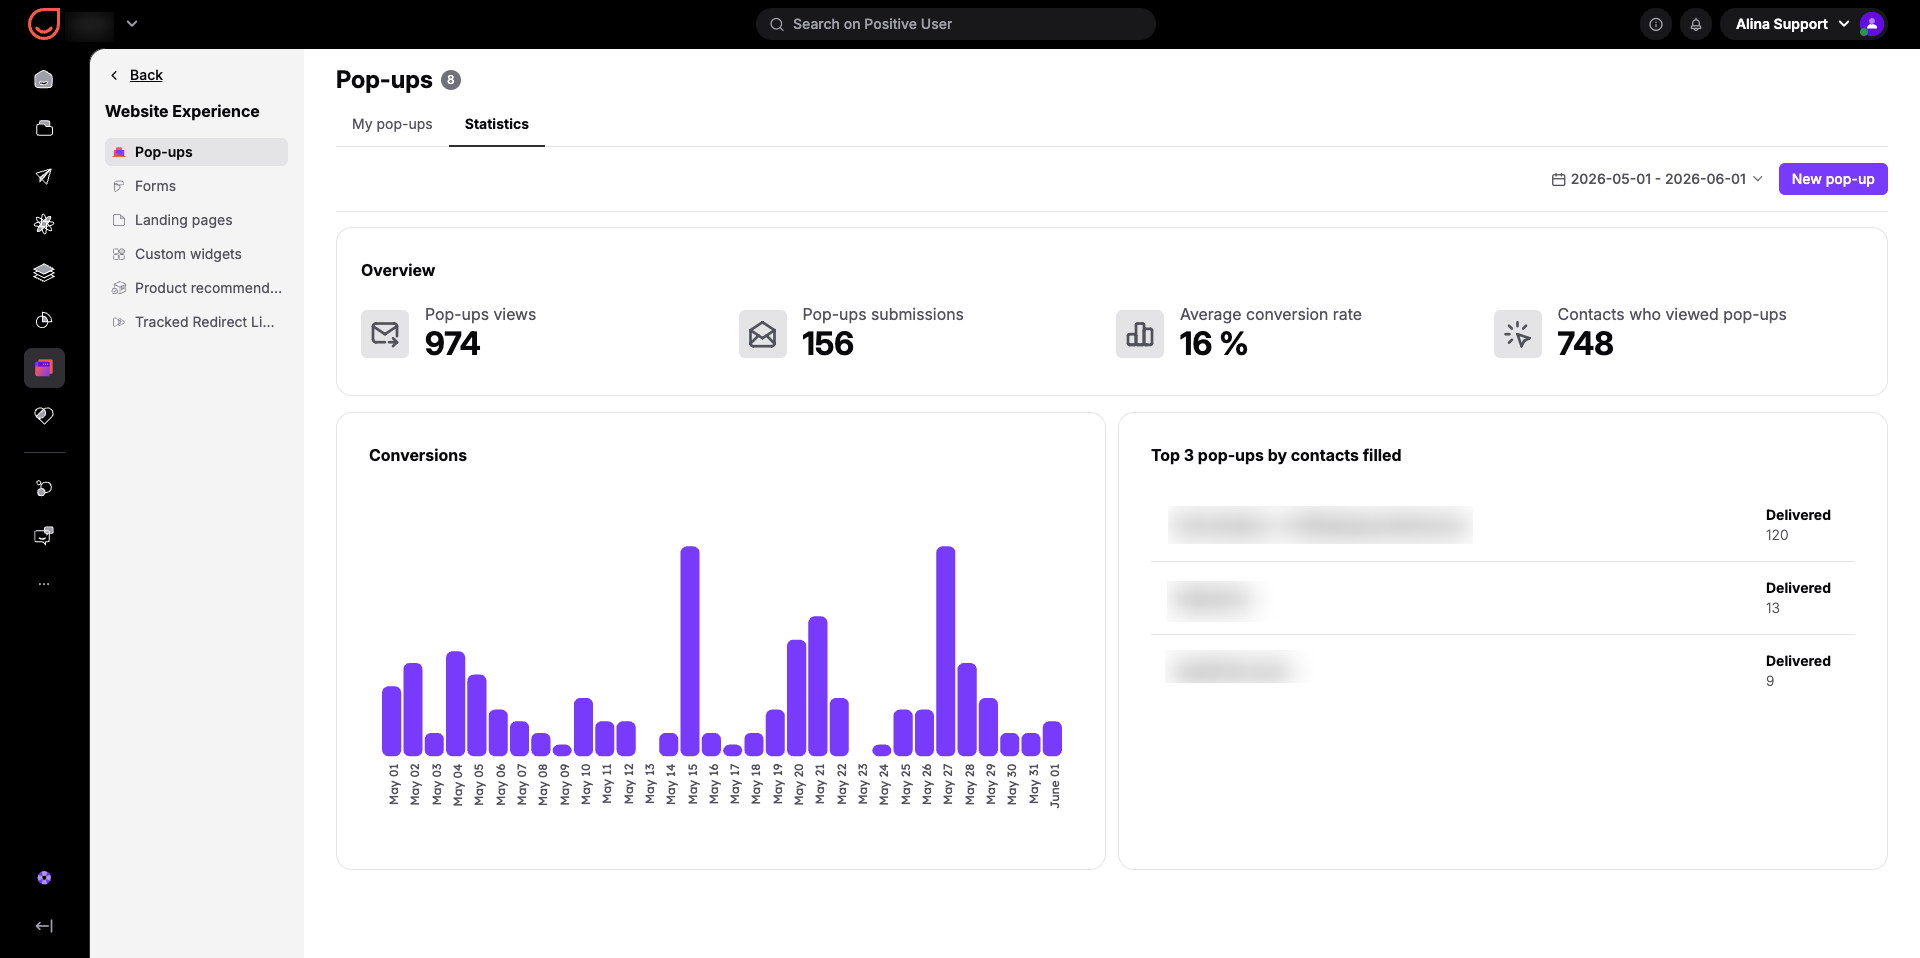
Switching to the dedicated "Statistics" tab provides an aggregated view of all your pop-up activities across the entire workspace. This view features several key widgets:
Overview: High-level totals for "Pop-ups views", "Pop-ups submissions", "Average conversion rate", and the total number of "Contacts who viewed pop-ups".
Conversions Chart: A daily bar graph tracking when submissions occur so you can analyze daily or weekly engagement patterns.
Top 3 pop-ups by contacts filled: A quick leaderboard highlighting your most successful pop-ups.
This entire dashboard can be filtered using the date picker in the top right to analyze specific marketing campaign windows.
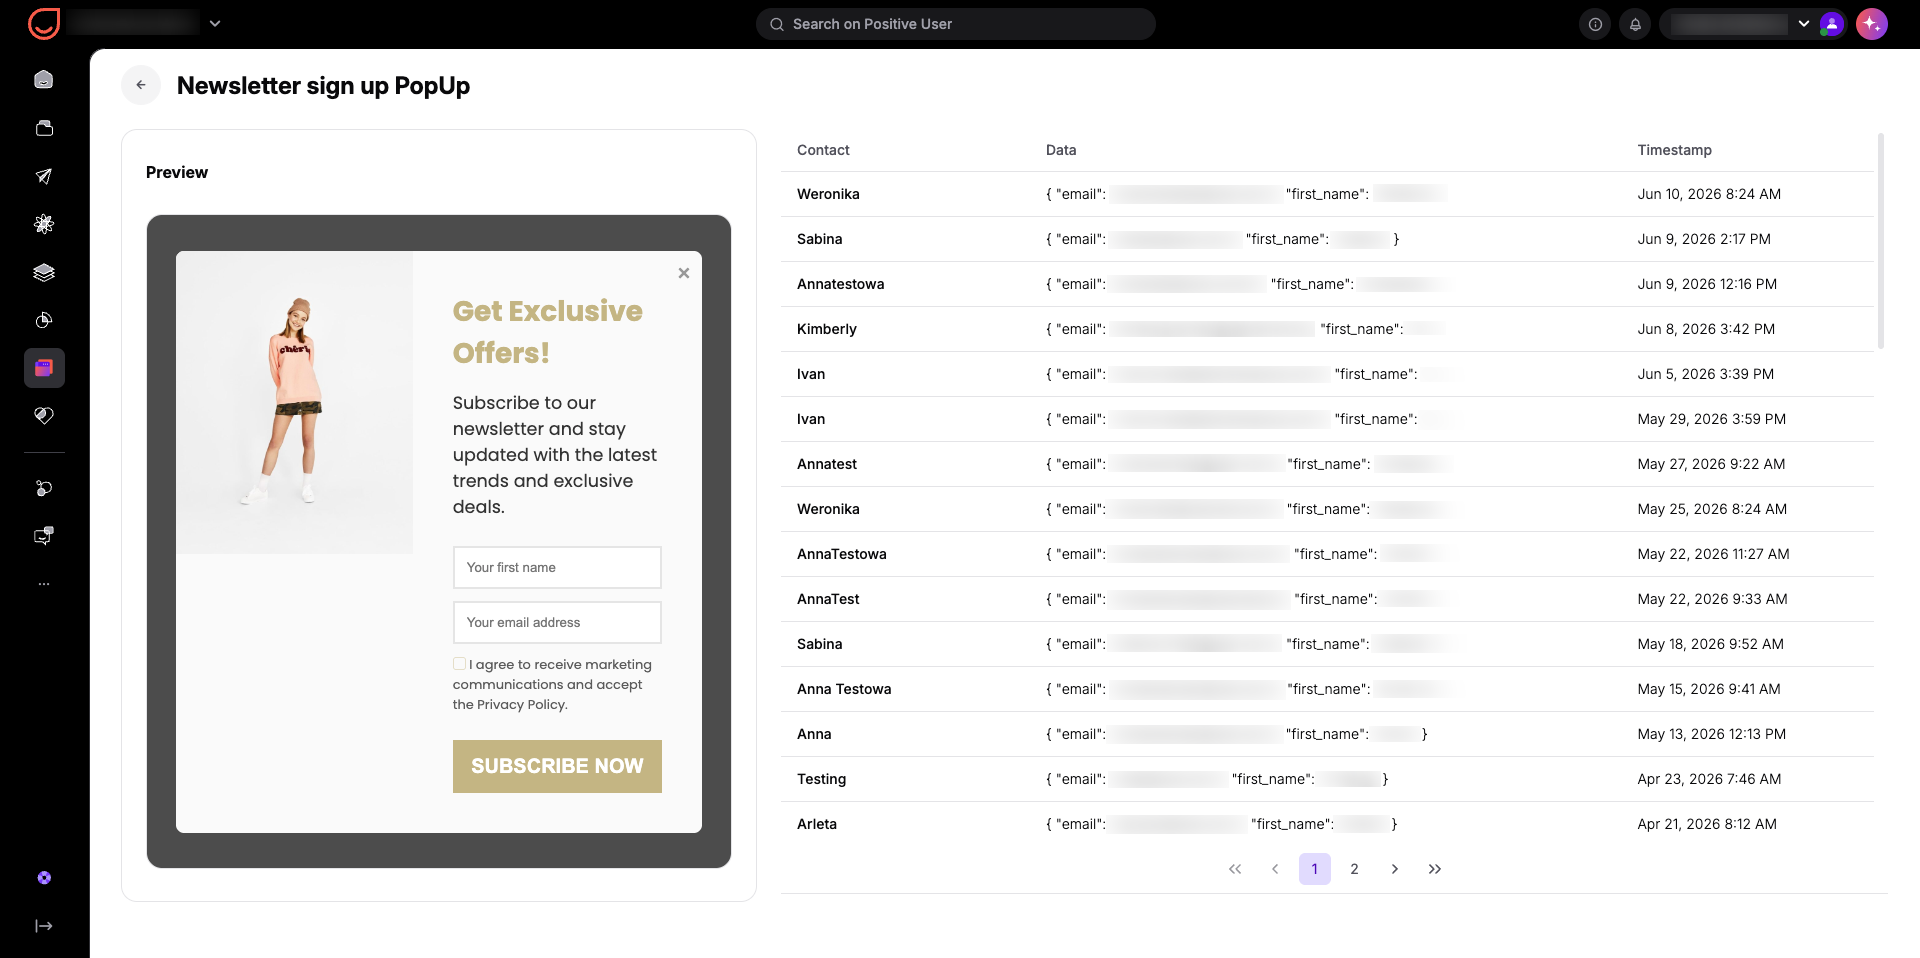
When you click on the name of any specific pop-up in the list, Positive User opens a dedicated view showing a preview of the design alongside a real-time activity log.
For input forms, this log lists every contact who filled out the form, the exact details they submitted in the "Data" column, and a precise "Timestamp".
For redirect pop-ups, it shows which contacts clicked through your link and when.
This lets your team see exactly who is engaging with your site in real time.
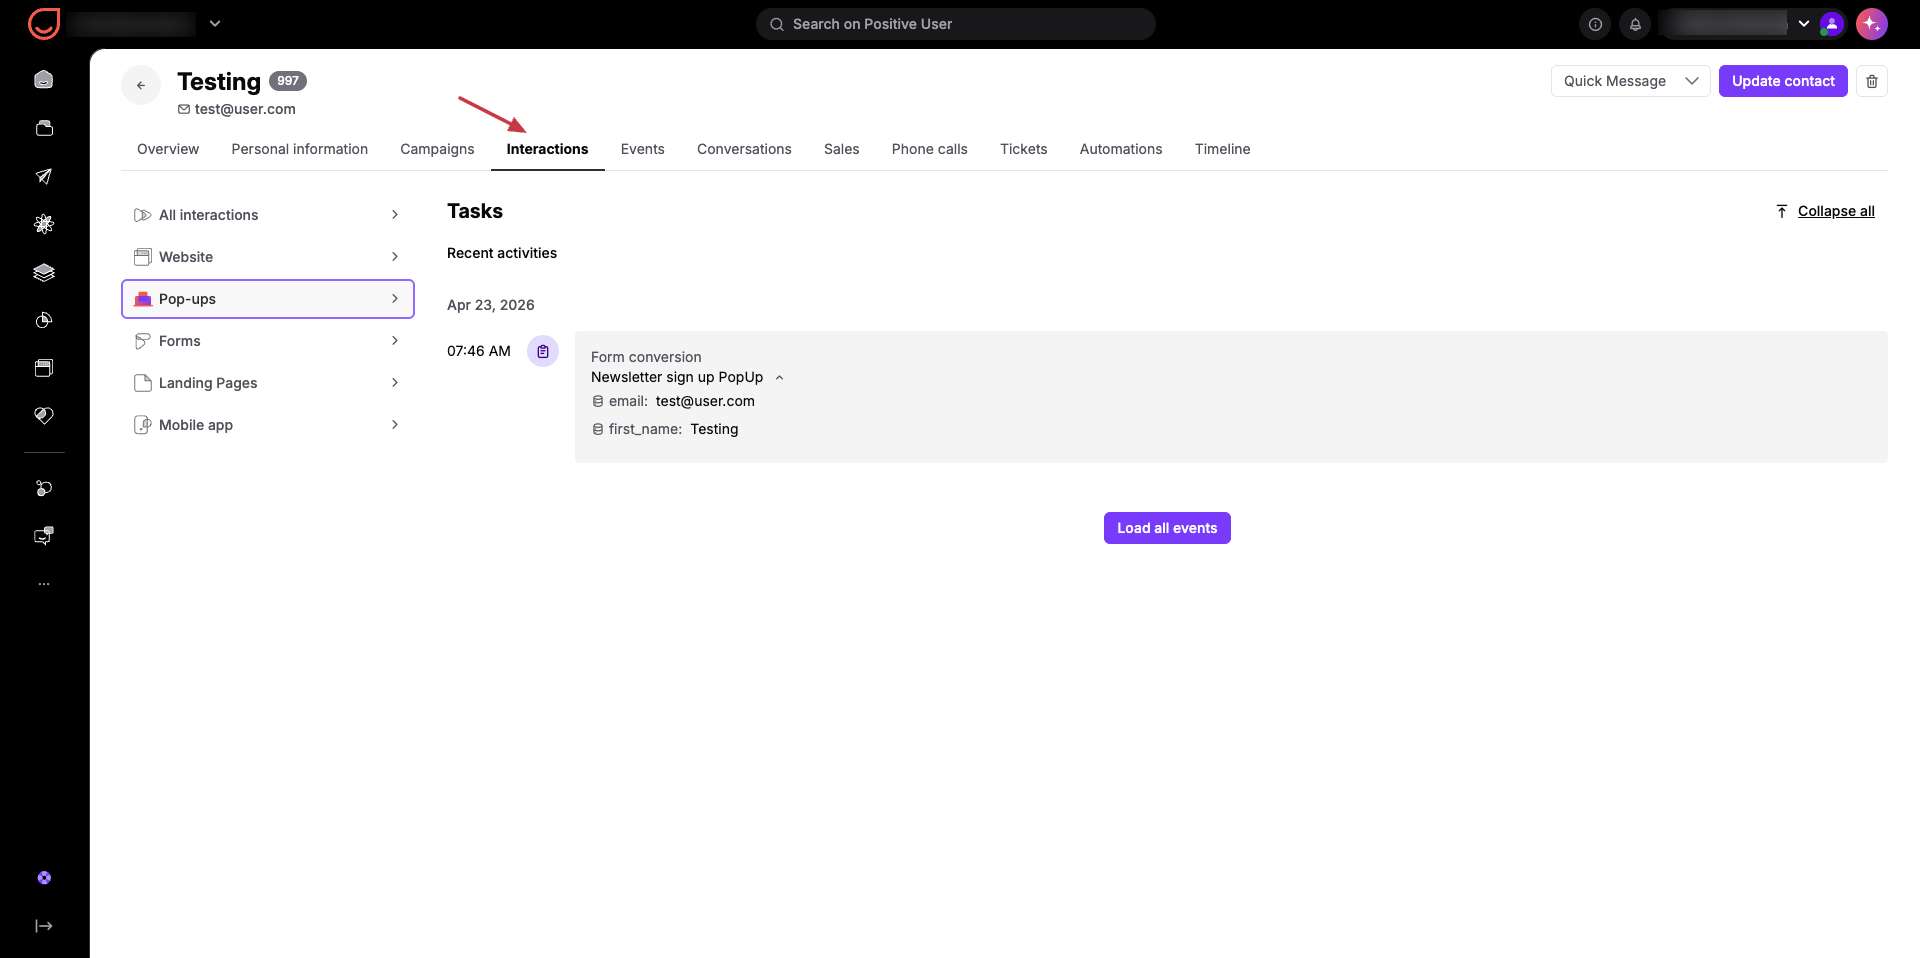
Beyond the main lists and dashboards, you can also view specific pop-up interactions directly on an individual contact's profile. Inside a contact profile, look at the top menu and click the "Interactions" section. From there, click "Pop-ups" on the left menu to view a full history of every pop-up message that specific contact has seen, clicked, or filled out.
Campaign Optimization: When your marketing team runs a seasonal promotion, you can use the date filter to see how your promotional pop-up performed during that specific week. If the metrics show high views but low clicks, your team can quickly update the headline or offer to improve conversions before the campaign ends.
Sales Follow-up: When a contact fills out a request form on your website, your sales team can immediately open that pop-up's individual log or view the contact's profile to see the exact details left in the form. This gives your team the necessary context to reach out with a personalized response while the contact is actively engaged.
Lead Source Tracking: By reviewing the dashboard metrics, your support and marketing teams can track which website messages drive the most customer inquiries or newsletter signups. This helps you understand what type of content or incentive works best for converting anonymous contacts into known leads.
