Measuring email performance helps you understand how your audience reacts to your messages and where you can improve. In User.com, email campaign statistics give you both high-level results and detailed, user-level insights, so you can optimize future campaigns based on real data.
Measuring the effectiveness of your email campaigns allows you to evaluate whether your communication meets your business goals. With email statistics, you can track engagement, identify delivery issues, and understand how recipients interact with your content.
User.com puts an invisible tracking pixel into every email message sent from the platform to track the email openings.
Each url from the campaign also includes a tracking element to get full info about clicks.
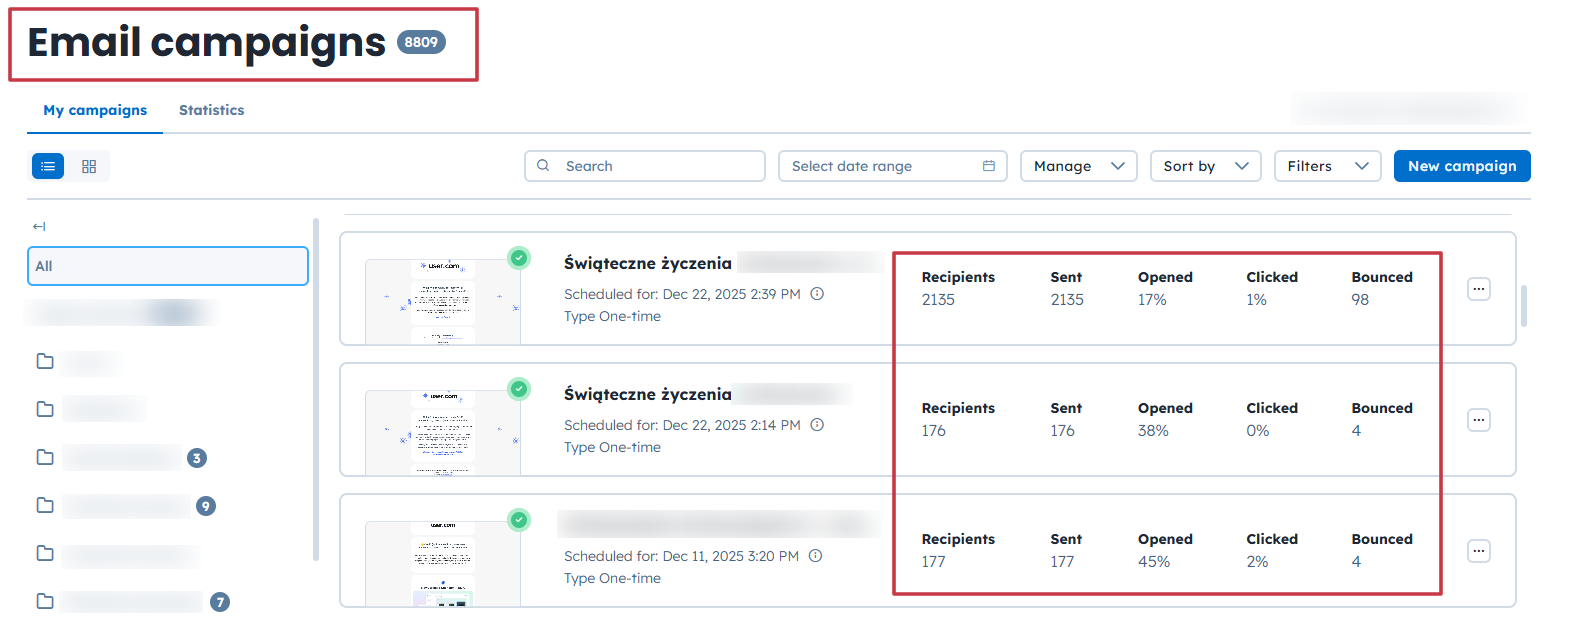
To see the main results of your campaigns, go to the “Campaigns” section. In the campaign list, you can find key metrics such as:
Number of recipients
Number of emails sent
Open rate
Click rate
Number of bounces (includes soft bounce, hard bounce and spam bounce metrics).

These indicators give you a quick overview of how each campaign performs.
On top of the “Campaigns” section you can apply the date range - then system will show you only statistics collected within a chosen period of time.
To get overall statistics about your email campaigns go to “Campaigns” → “Email” → “Statistics” section.
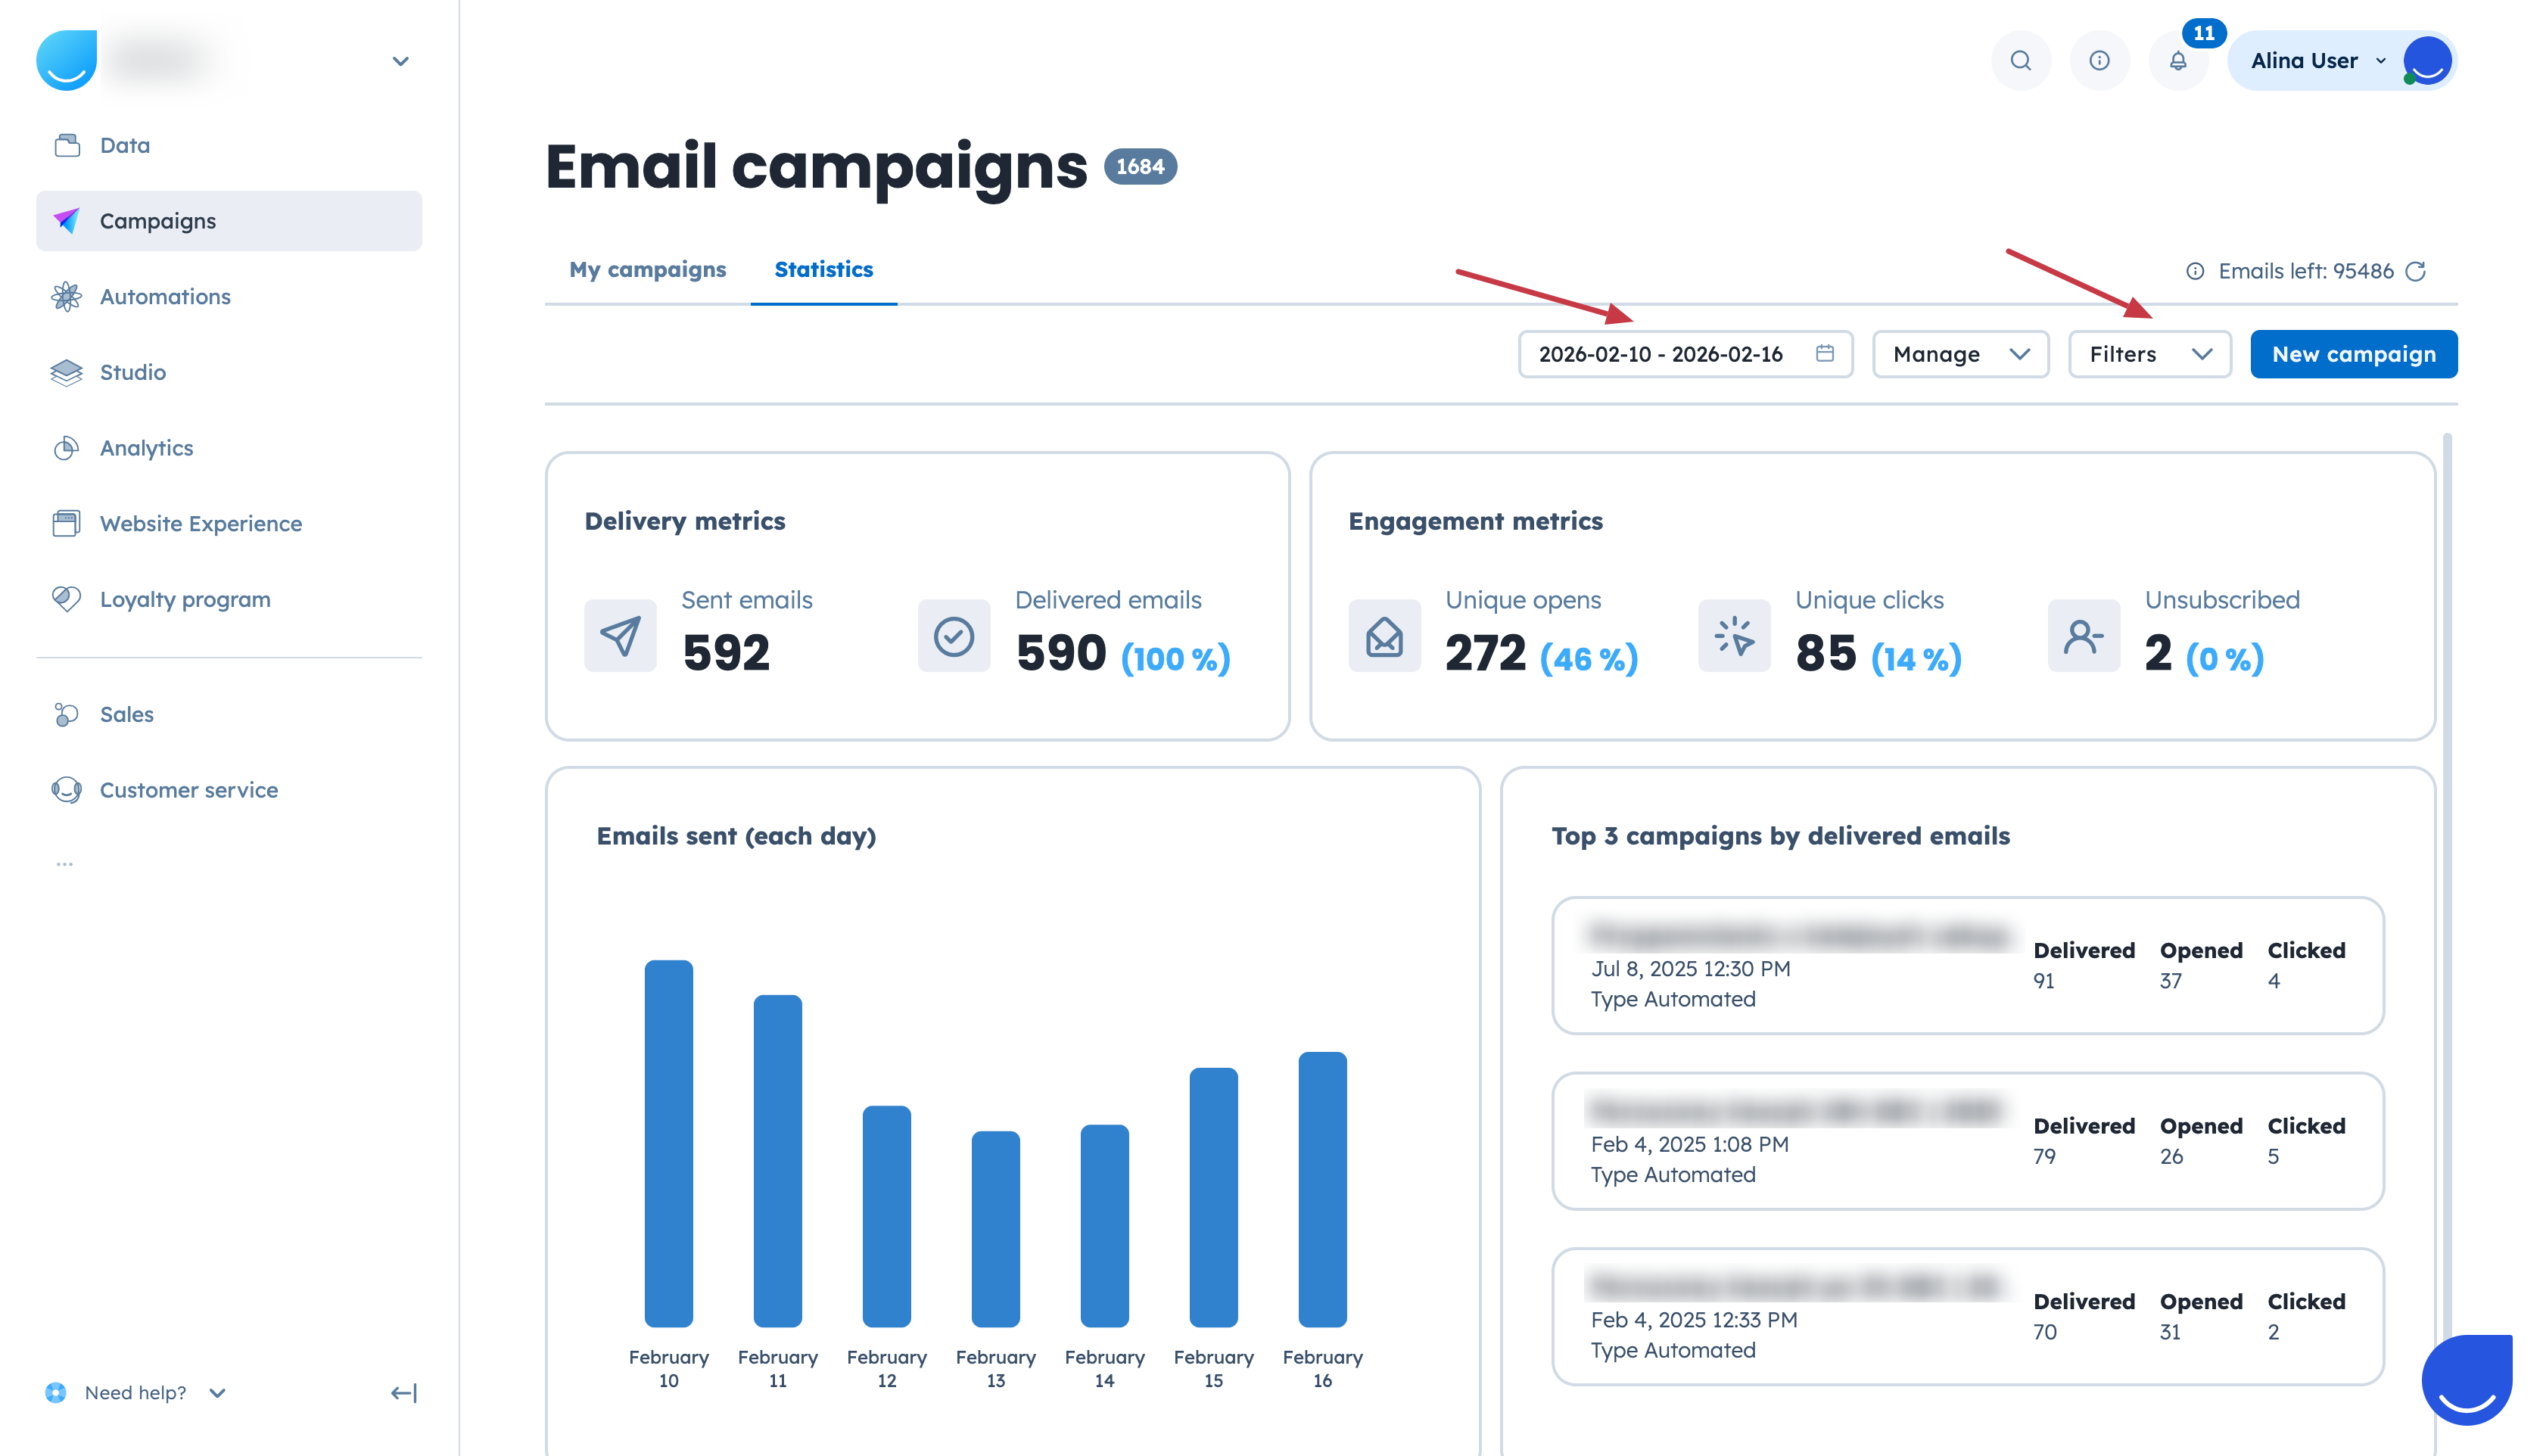
Here you have access to all main statistics:
Delivery metrics (sent / delivered)
Engagement metrics (unique opens / unique clicks / unsubscribes)
Top 3 campaigns by delivered emails (by highest number of deliveries within a given period of time)
Daily delivery stats
Moreover, you can apply filters by campaigns type (one-time / automated) or choose the period of time you want to check statistics for.
For more in-depth results, click the name of a specific campaign from the campaign list. This opens the campaign profile, where performance data is grouped into several sections:
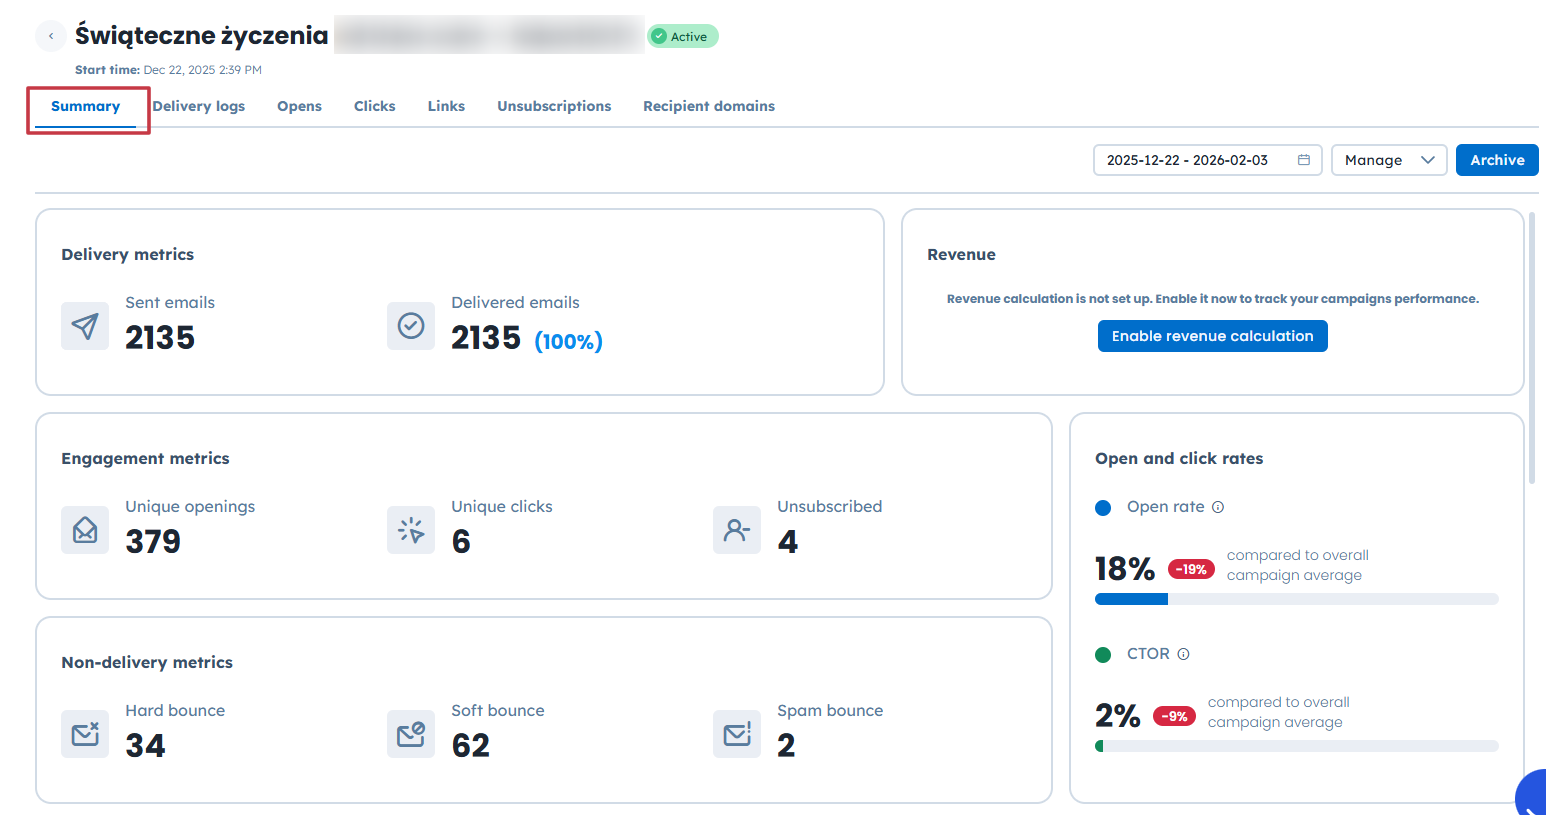
In the Summary section, you can review aggregated statistics, including:
Delivery metrics: Here you can heck how many emails were sent vs how many of them got delivered.
Engagement metrics: This section includes number of unique openings, clicks and unsubscribes.
Non-delivery metrics: These statistics show the number of hard bounces, soft bounces and spam bounces. Remember, that these metrics are collected only from User.com providers.
Performance overview: Date-by-day numbers about delivered, opened and clicked emails.
SMTP information: Details about the email provider responsible for campaign delivery.
Revenue: Dedicated calculations about income this specific campaign brings. More info.
Open and click rates: Percentage of delivered emails that were opened at least once by recipients.
Message: Preview of the content. Click on three dots in bottom right corner of the miniature to ge access to a heat map and editing options.
If your campaign includes A/B testing, bottom part of the campaign profile will show a comparison of results for each variation used.
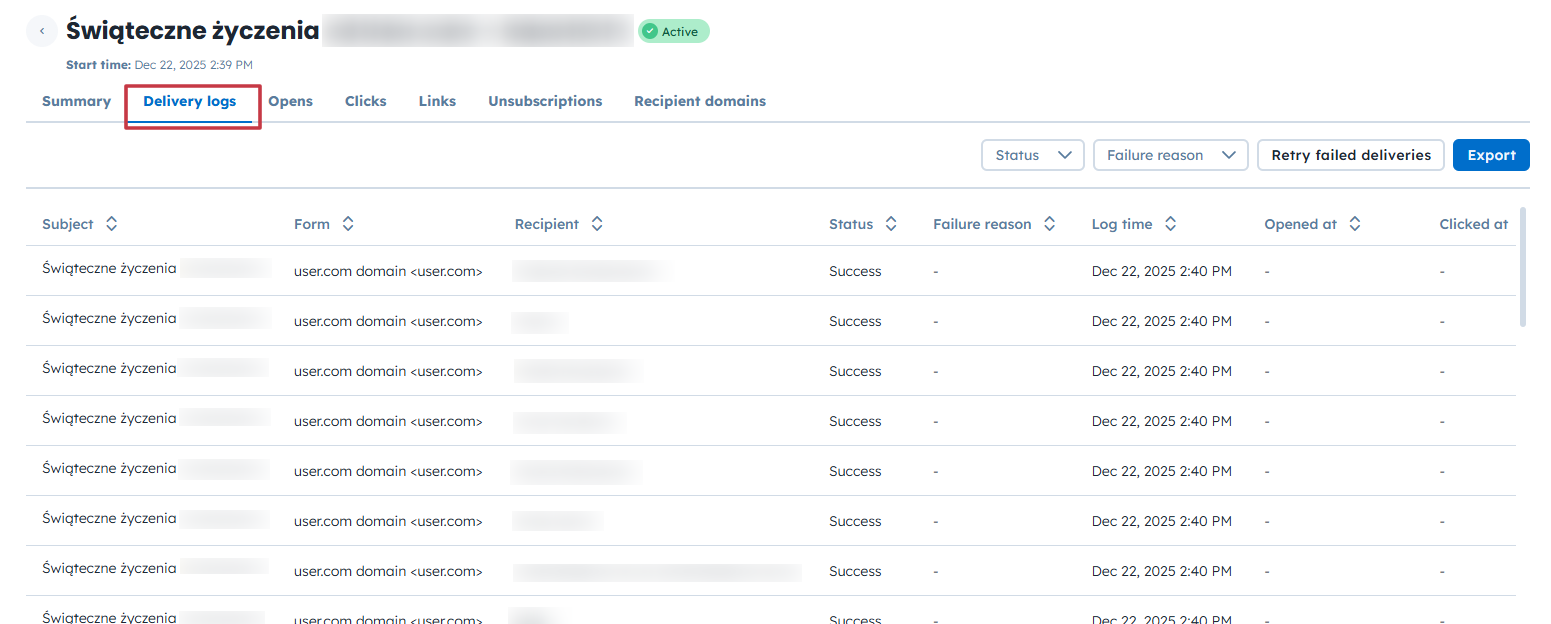
The “Delivery logs” view presents a detailed list of all sent emails. You can see:
Subject line of the message used in the campaign
Email address the email message was sent from
Each recipient details
Status of the delivery (success/failure)
Failure reason (in case of unsuccessful delivery)
Delivery date
Open and click date
This view is especially useful when troubleshooting delivery issues or dispatch failures.
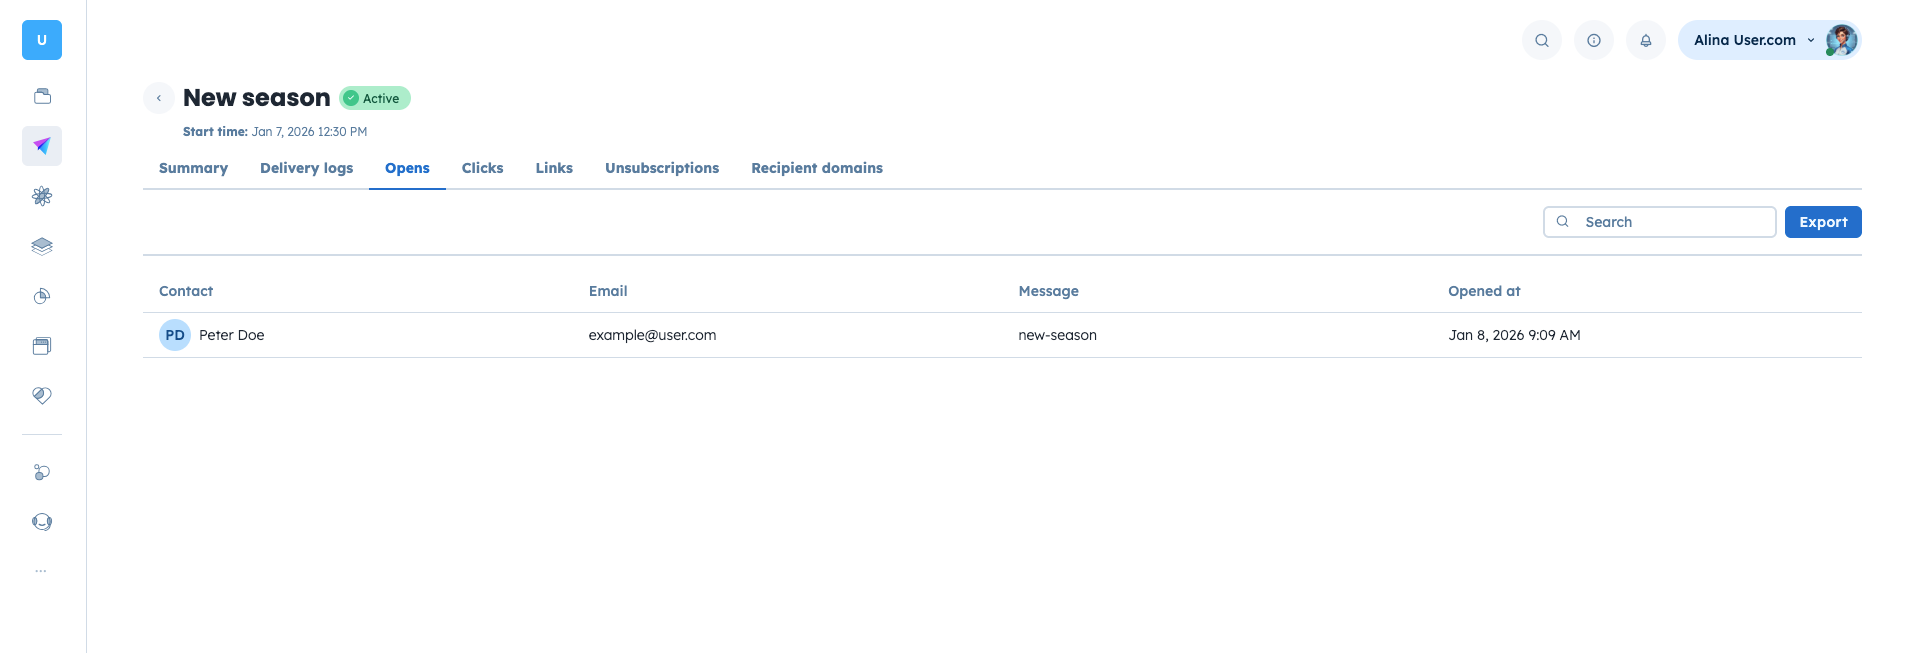
Monitor individual email engagement with detailed information about who opened your message and when, including the specific message and timestamp. This visibility helps you track contact activity, identify the best timing for follow-ups, assess engagement trends over time, and support more informed sales and marketing decisions based on real interaction data.
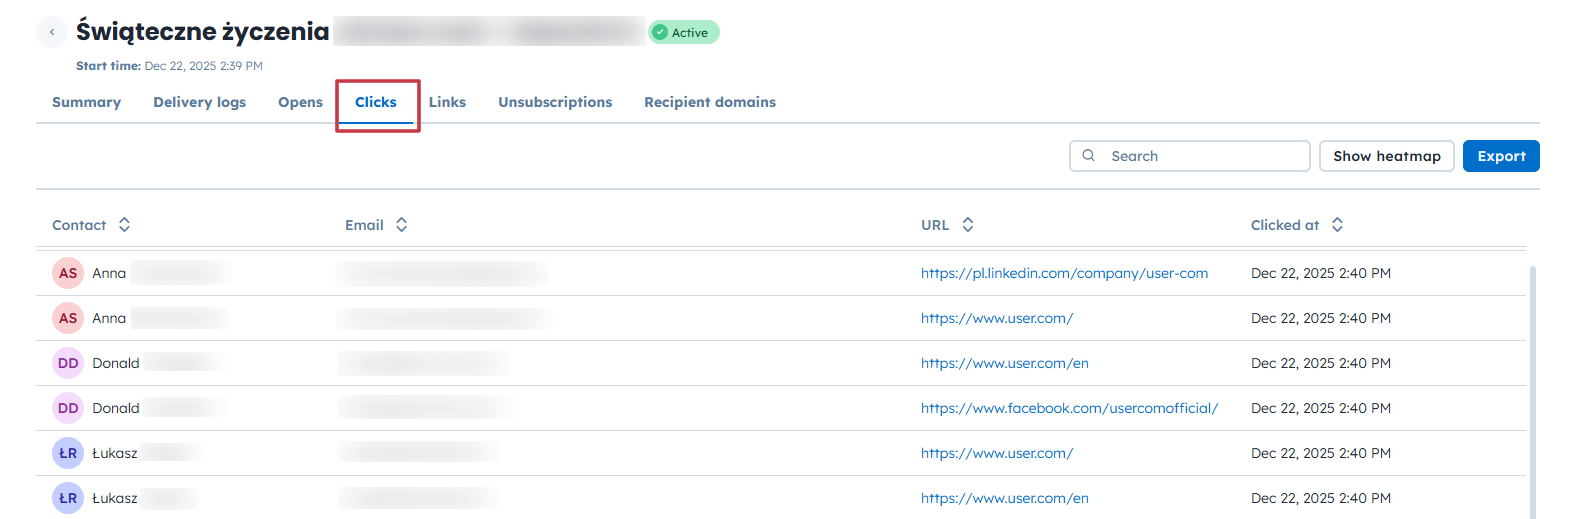
Gain clear insight into individual engagement by viewing which links each contact clicked and the exact timing of those interactions. This behavioral data helps you identify interest areas, detect buying intent, trigger timely follow-ups, personalize future communication, and prioritize leads based on real actions rather than assumptions.
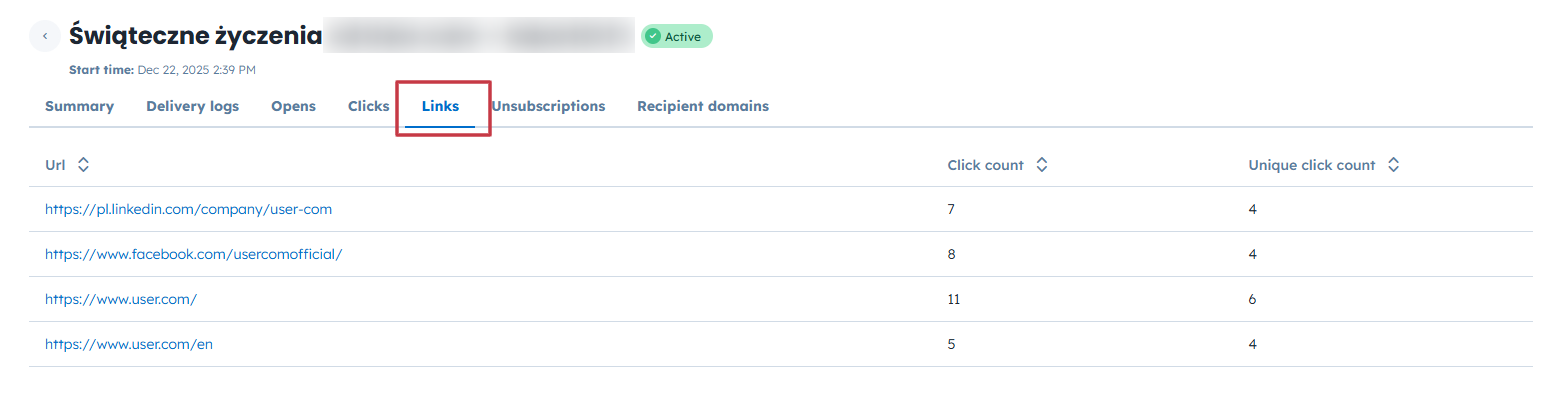
See how many clicks each link in your email received to quickly identify which CTAs and content blocks performed best. This helps you evaluate audience interest, optimize email structure and messaging, refine future campaigns, and focus on the offers or topics that drive the most engagement.
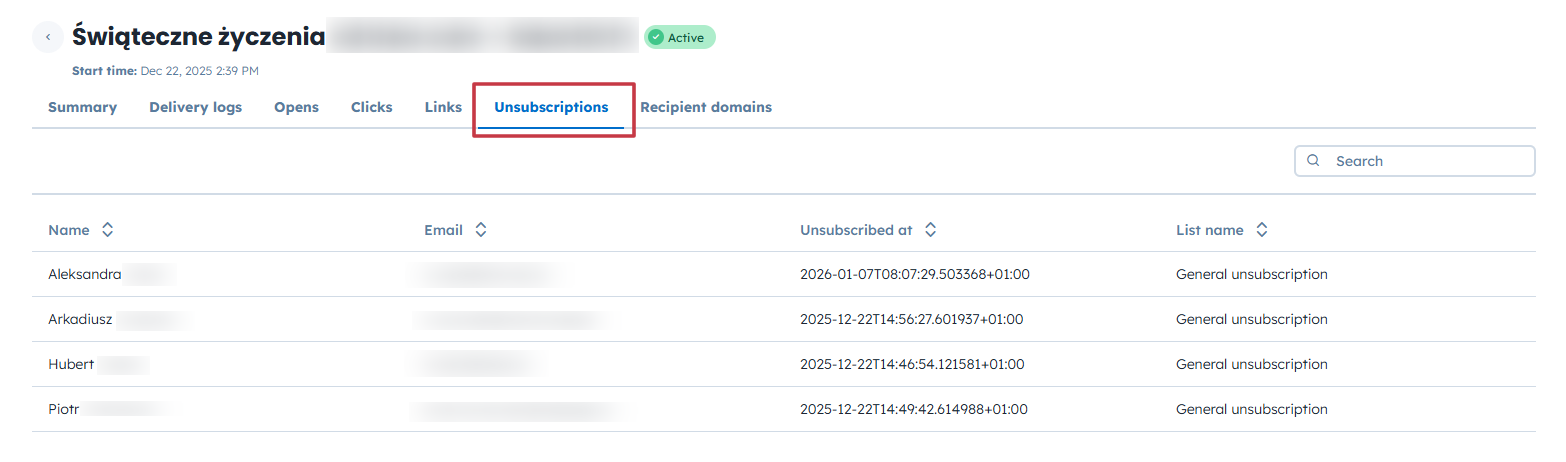
This section displays a full list of contacts who clicked the Unsubscribe link in your email campaign, helping you quickly identify opt-outs, monitor audience retention, and analyze potential issues with campaign content, targeting, or sending frequency.
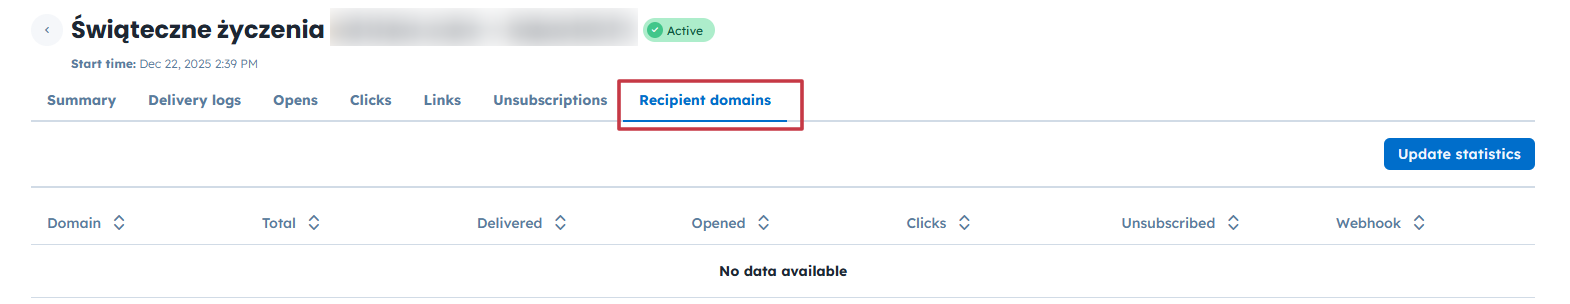
Here you can see which email domains are represented in your database, making it easier to identify the most commonly used providers. This insight helps you prioritize testing and optimization for specific domains (e.g., Outlook), improve deliverability diagnostics, and adjust formatting or rendering to match the environments your audience actually uses.
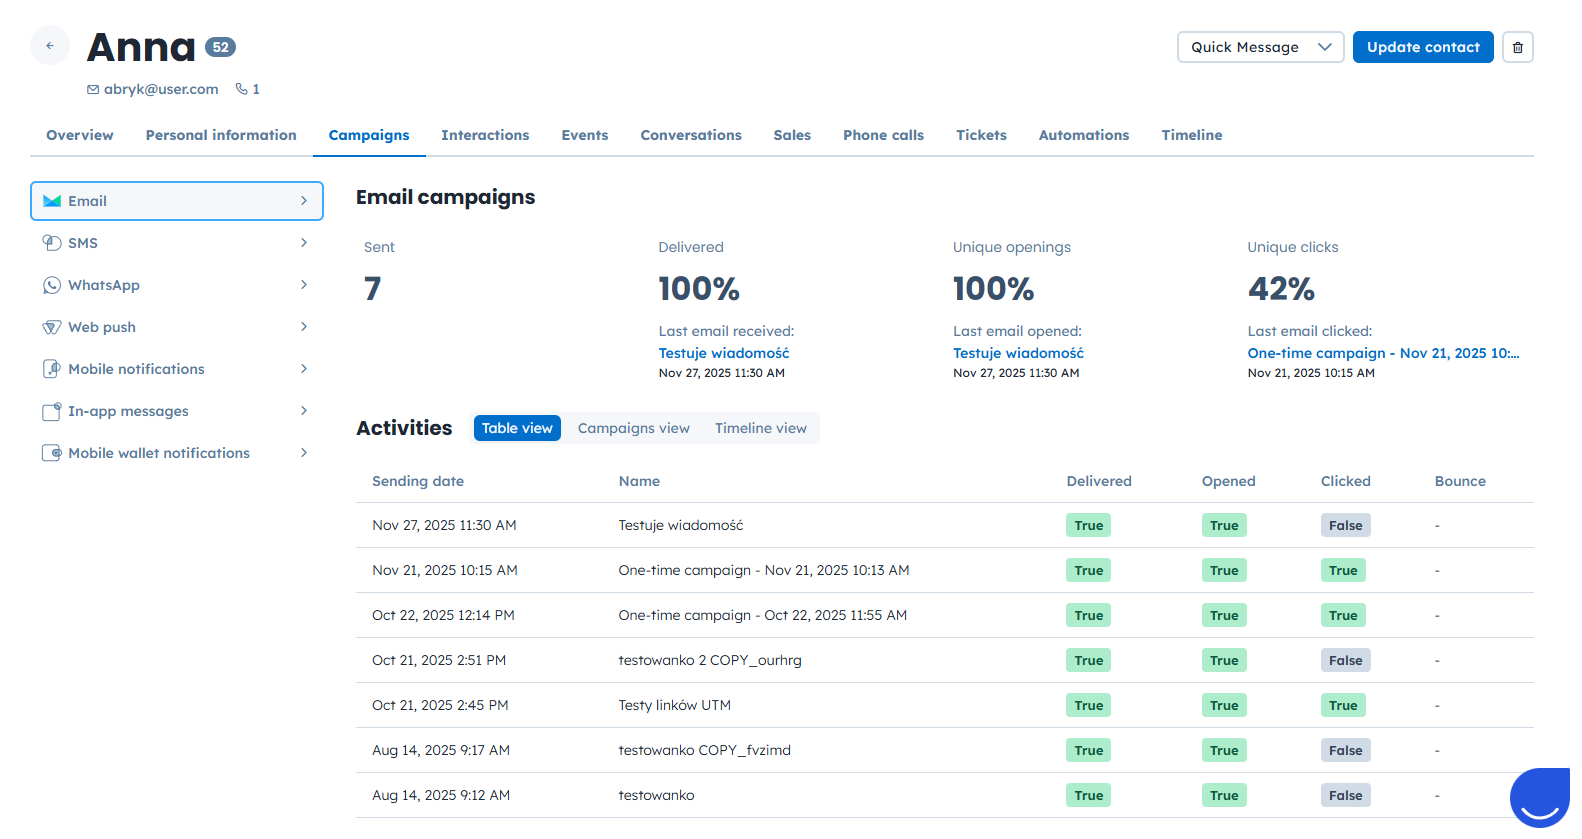
User.com also lets you analyze email activity on a per-contact level.
Open a contact profile.
Choose “Campaigns” section from the top panel.
Pick “Email” option from the list on the left.
Here you can check the following details:
Number of sent campaigns
Percentage of delivered campaigns
Percentage of unique campaign openings
Percentage of unique campaign clicks
Bounce parameters
For better transparency you can switch between table, campaign and timeline views.
Email open rates are calculated using a tracking mechanism. When you send a campaign, an invisible tracking pixel is automatically added to the email.
When a recipient opens the email in their email client and images are downloaded, the tracking pixel is requested from the server and the open is recorded in the campaign statistics.
However, this method has limitations:
Some email clients block images by default, so an open is only detected after an additional action, such as clicking a link or allowing image downloads.
Emails read offline cannot trigger the tracking pixel.
Because of these factors, open rate tracking is not 100% reliable.
Understanding email statistics helps you:
Optimize subject lines and content based on open and click rates
Identify the most engaging links and calls to action
Detect delivery problems early using delivery logs
Improve list quality by monitoring unsubscribes
