Landing page statistics give you a clear view of how well your web pages are turning traffic into real business results. Instead of guessing whether your marketing efforts are working, these metrics show you exactly how people interact with your pages, when they engage, and how often they fill out your forms.
You can find these insights inside your Positive User workspace by going to the "Website Experience" → "Landing Pages" section.
Understanding these numbers helps your team make smart marketing decisions based on real data rather than guesswork. When you measure your page performance, you gain several business advantages:
Optimize your marketing spend: See exactly which ads or email campaigns bring in people who actually complete your forms, so you can focus your budget where it works best.
Improve your conversion rates: Identify pages that get high traffic but low signups. This signals that you need to adjust your layout, copy, or offer to better match what your audience wants.
Analyze your campaign timing: Use date filters to see how specific promotional periods, ad campaigns or product launches affected your engagement over time.
When you open the "Landing Pages" section, you can explore your data across two main tabs to look at individual page listings or high-level trends.
The "My landing pages" tab acts as your central library, displaying every page you have created, including both drafts and active pages. Here, you can track general performance at a glance across two main columns:
Total views: The total number of times your page has been displayed to web traffic. This measures your absolute reach. A high number means your promotional channels (like emails or social media posts) are successfully driving traffic to your page, while a low number indicates you need to work on how you market the page link.
Total conversions: The percentage of filled forms on the landing page out of the total view count. This is your primary page-quality indicator. It highlights how persuasive your page is - a high percentage means your content matches what your target audience expects, while a low percentage suggests your page copy or offer needs refinement.
To analyze specific marketing actions, click the "Select date range" dropdown to look at performance during a precise timeframe. You can also organize your library by clicking "Sort by" or filtering by "Status" to find specific pages instantly.
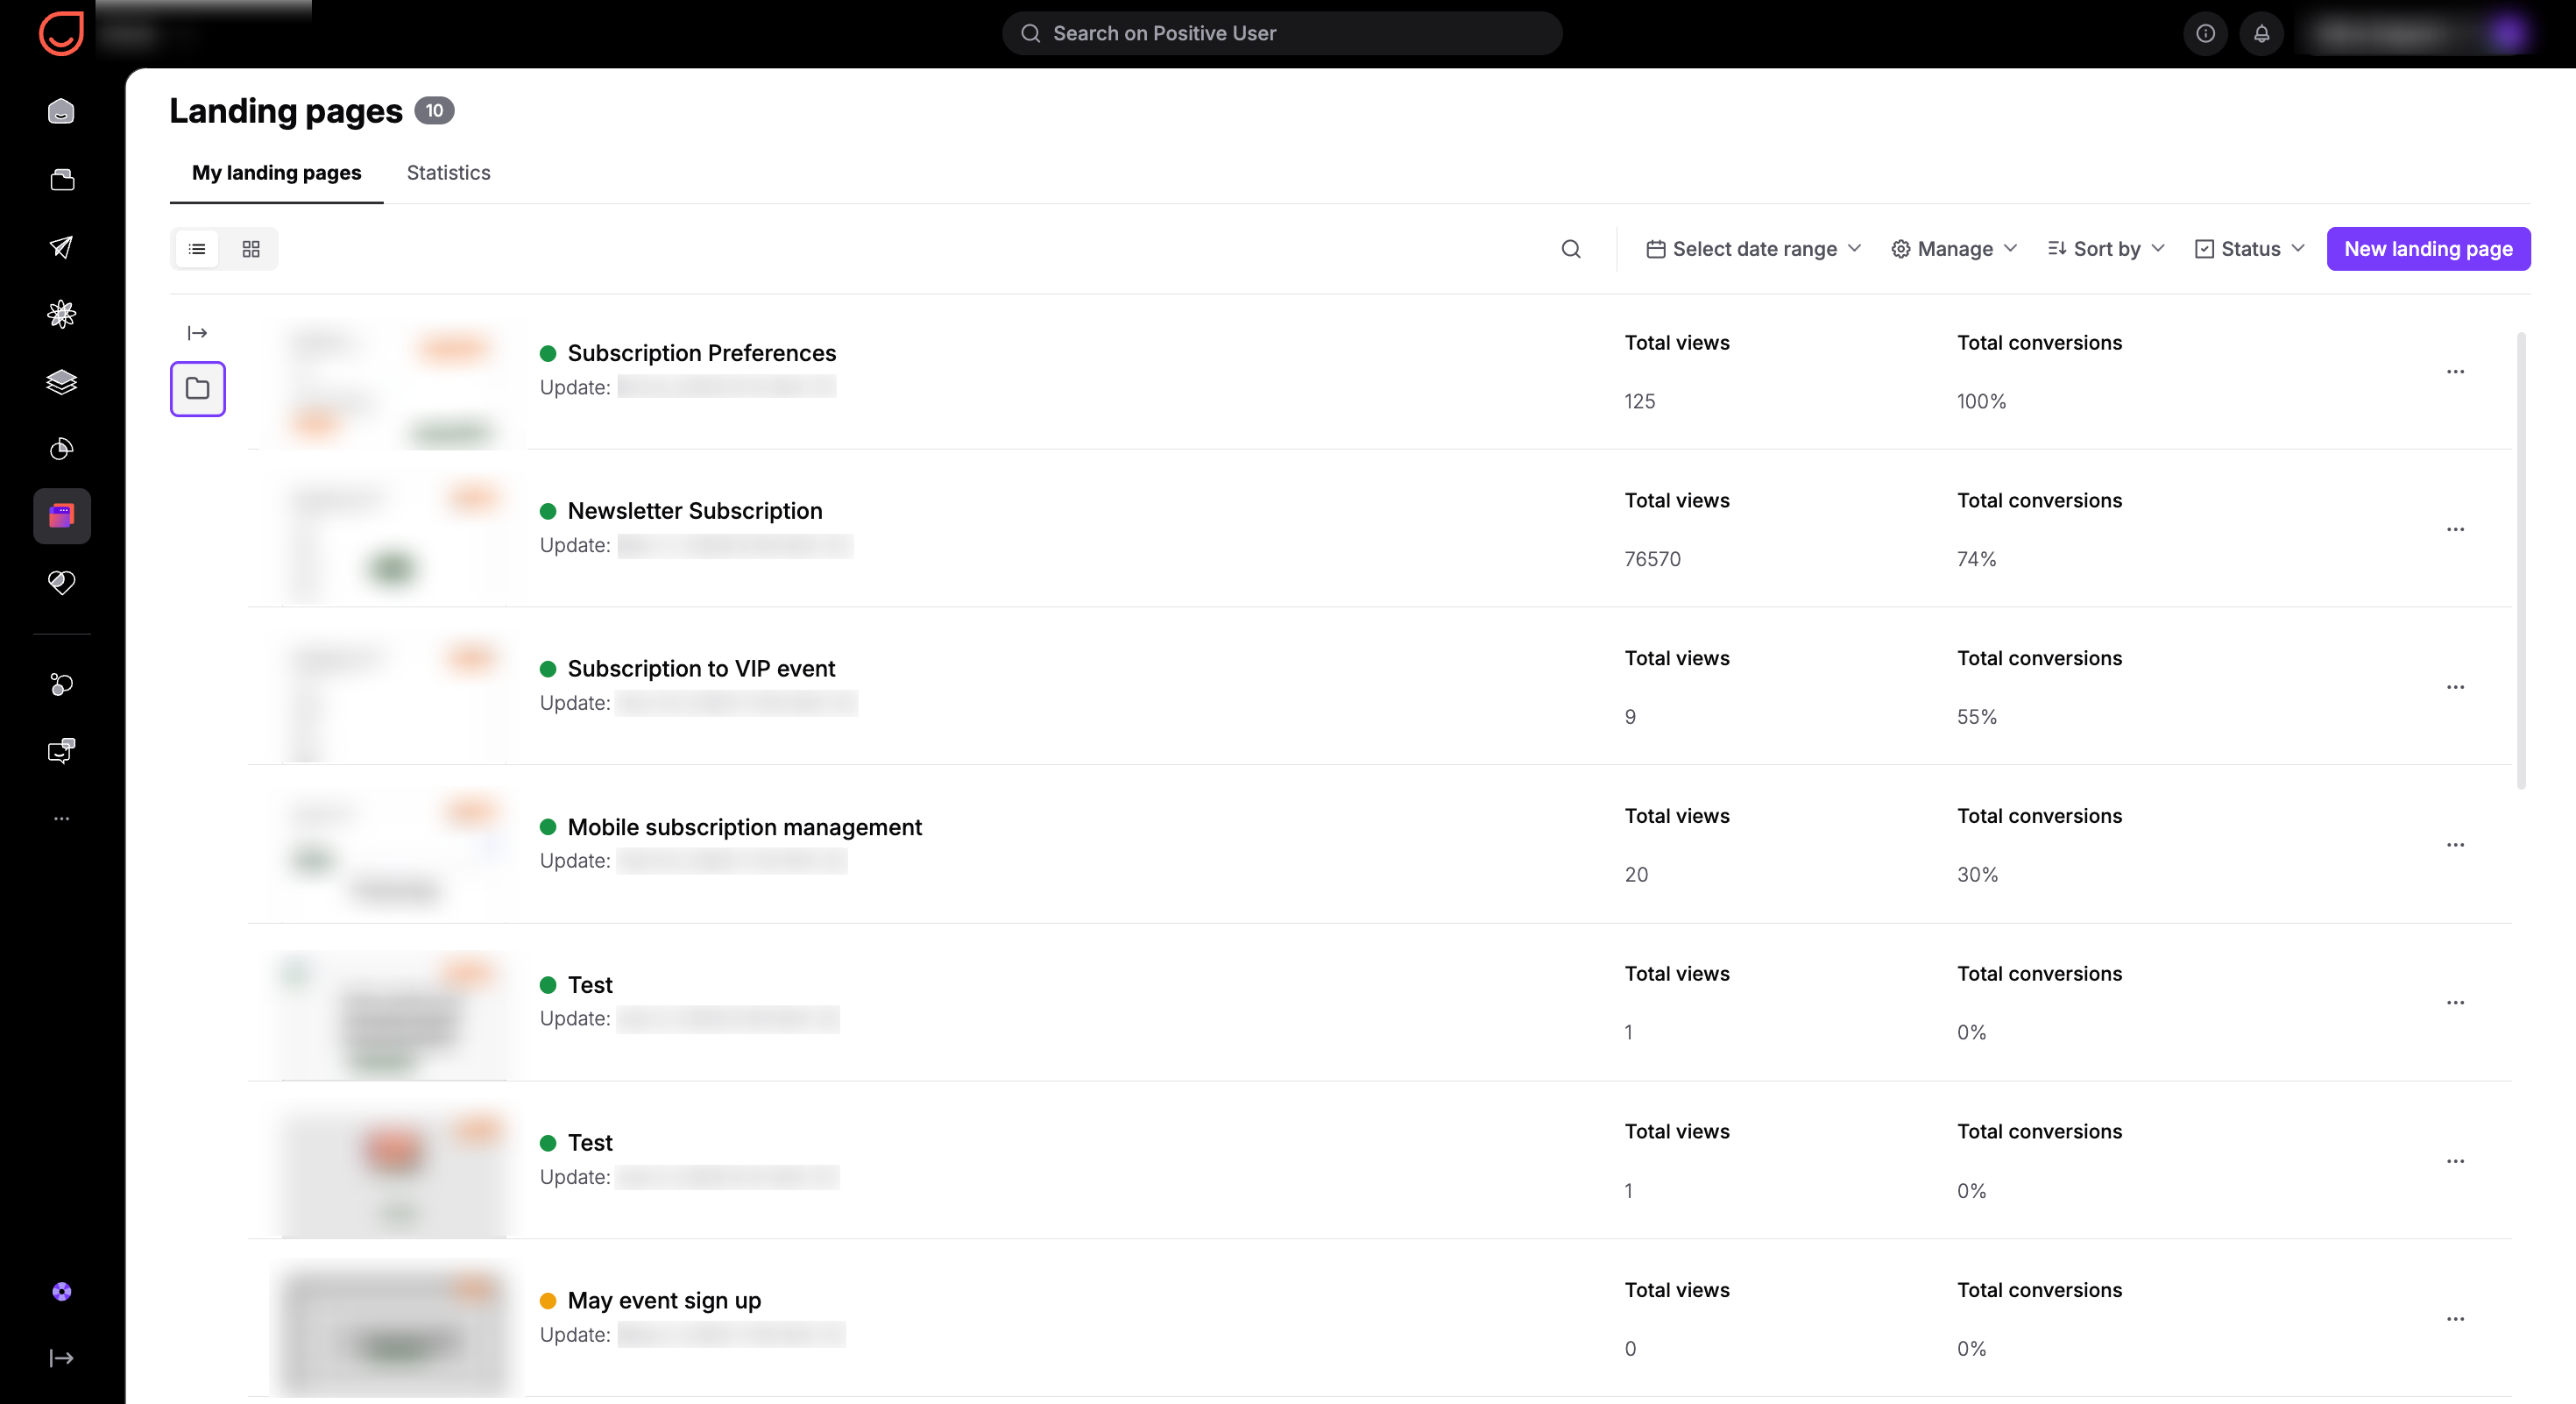
Switching to the "Statistics" tab gives you an aggregated overview of how all your landing pages are performing collectively. This view highlights several key business metrics.
Overview:
Total visits: The overall number of times your landing pages were loaded. This highlights your total brand exposure across all active landing pages.
Total conversions: The total count and overall percentage of successful form completions across all pages. This indicates how well your digital strategy captures leads as a whole.
Number of unique visitors: This tracks individual people who visited your pages, filtering out multiple visits from the same person. This metric shows the true size of the unique audience you reached.
Average conversion rate: The ultimate health metric for your landing pages. It reveals the overall efficiency of your setups. If this rate drops, it suggests that while you might be getting traffic, the audience might not find the content relevant or the forms might be too long.
This tab also includes a daily “Conversions” chart to help you visualize trends over time and a “Top 3 landing pages by conversion” table that highlights your top-performing digital assets. You can apply a date range filter here to isolate specific timeframes and see how your marketing strategy is performing month-over-month.
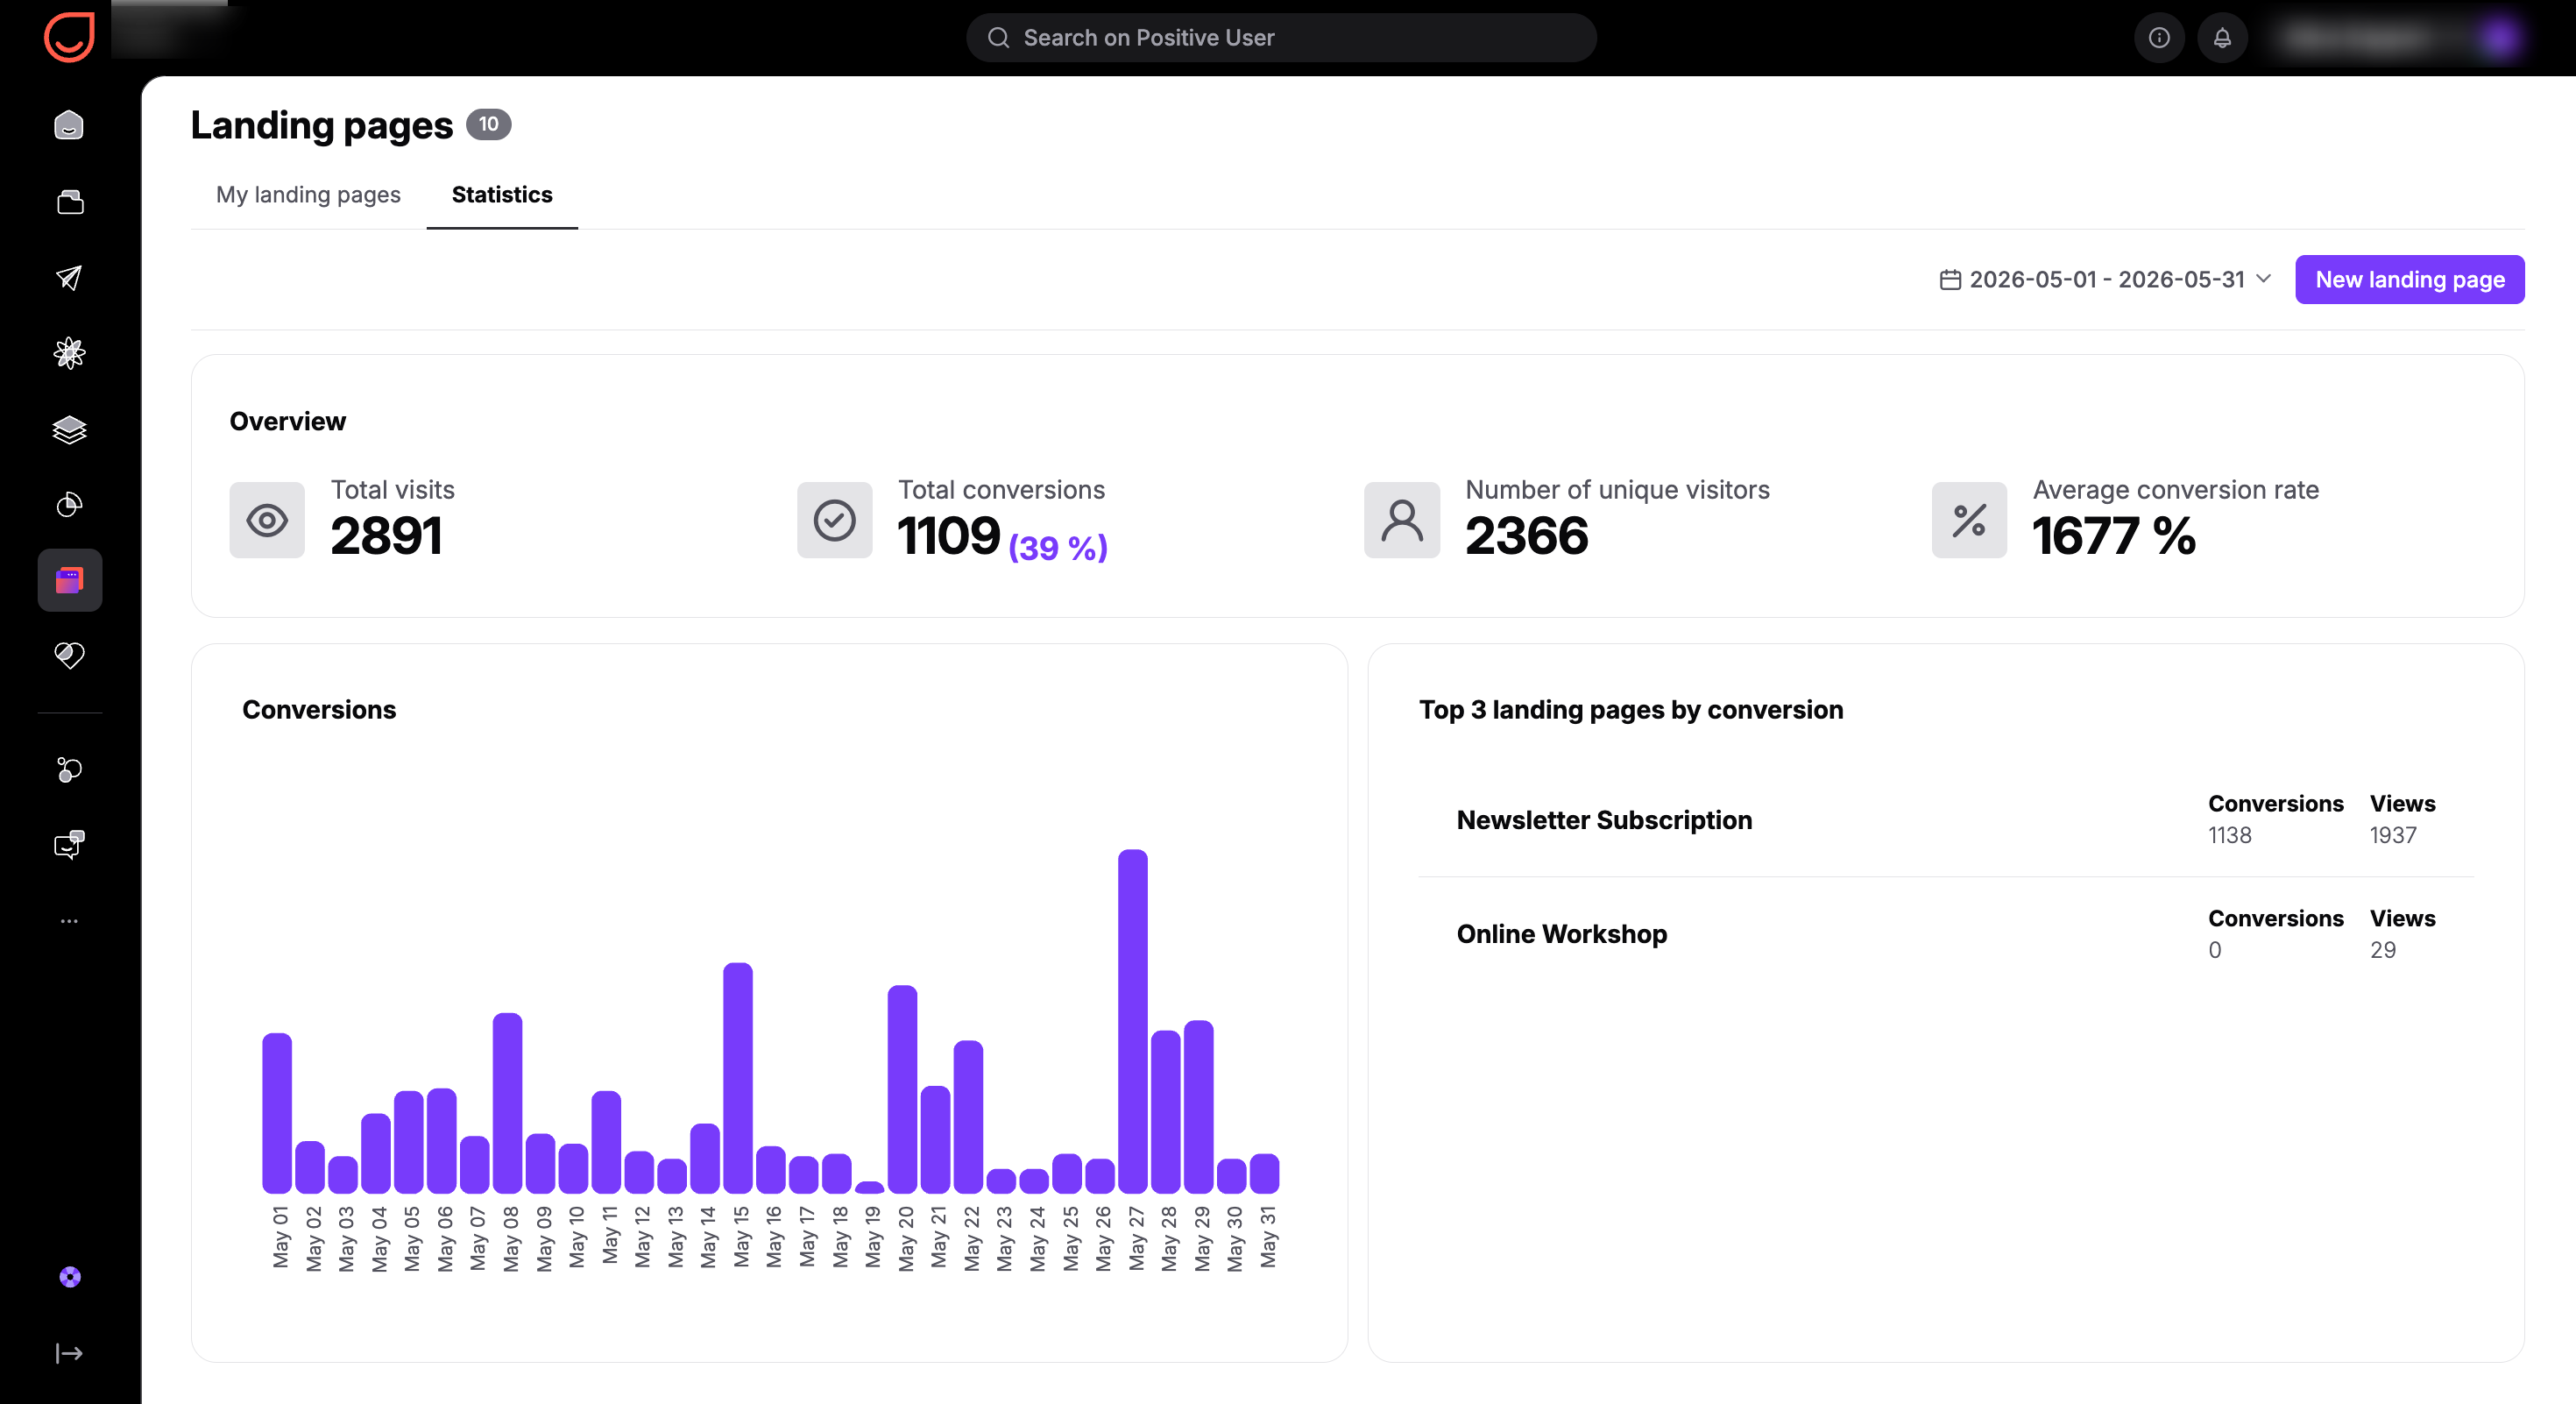
If you click on the name of any landing page, Positive User redirects you to its individual profile. Inside the landing page profile, your team can dive deep into performance across four distinct tabs.
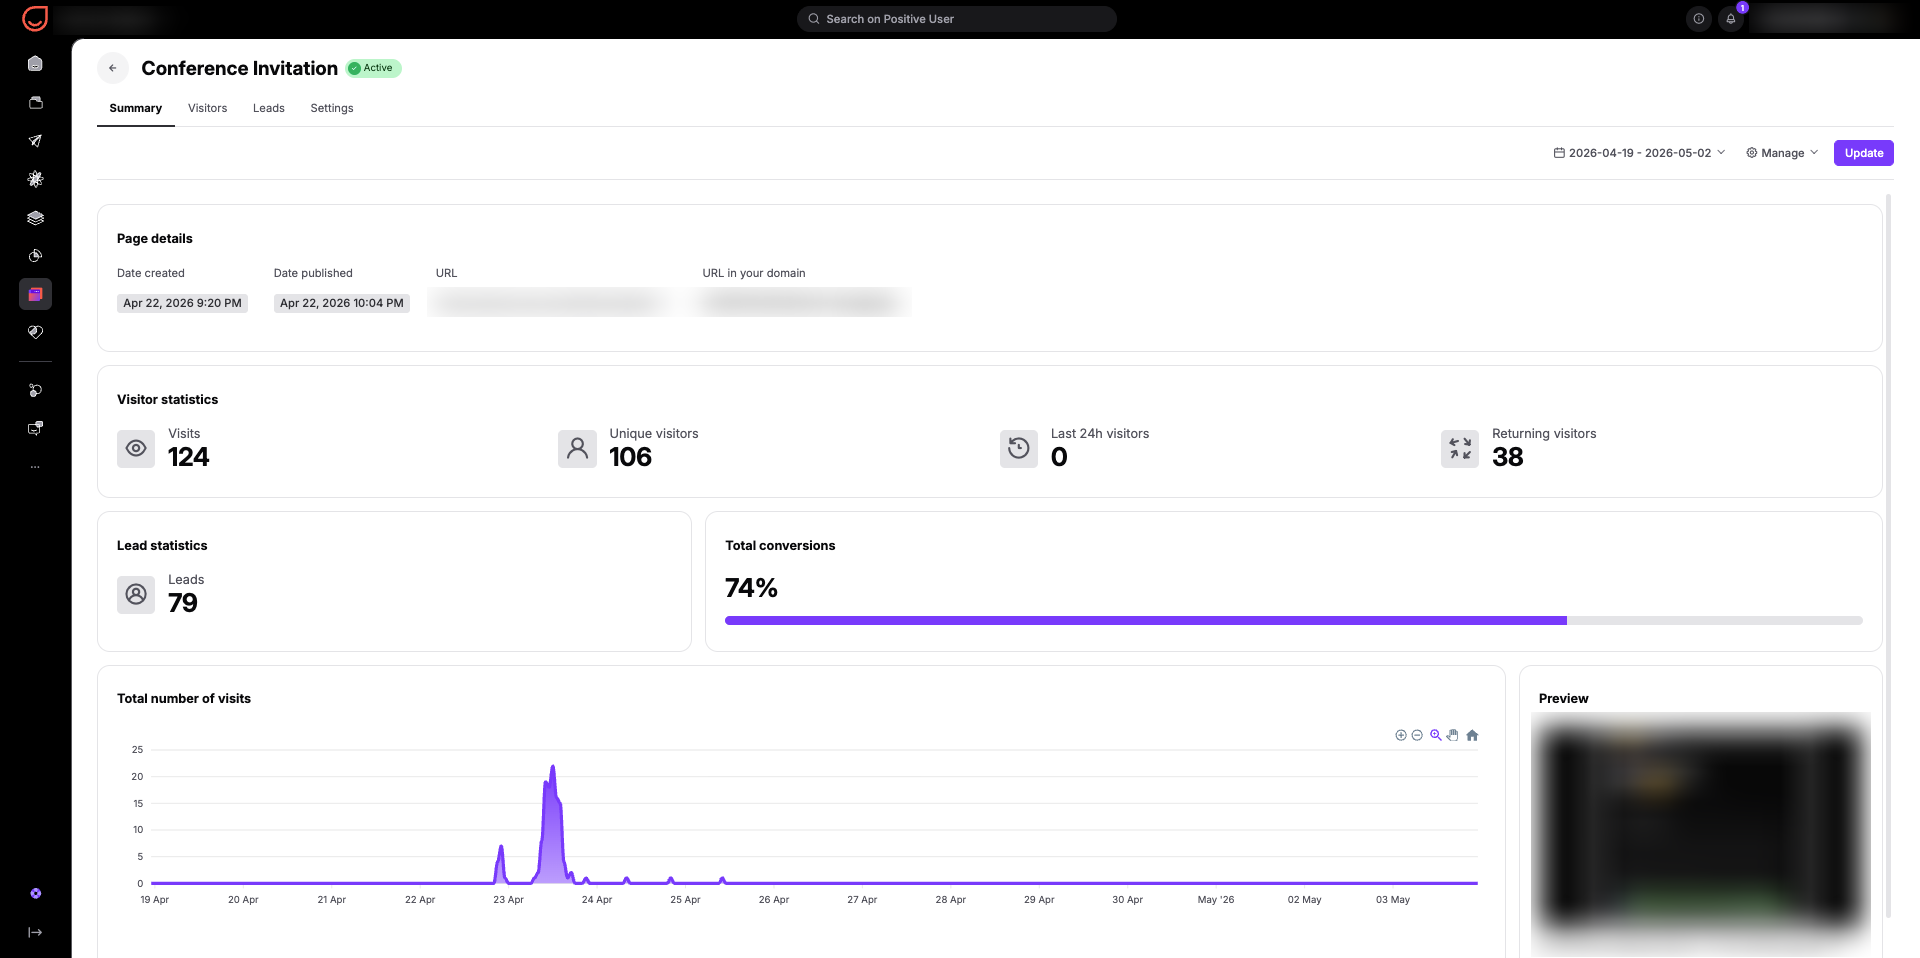
The "Summary" tab is the first view you get, offering a standalone snapshot of the page’s specific health. It contains several key data blocks:
Page details: Displays the creation date, publication date, and live URLs. This ensures your team can instantly verify live links and track the page's operational timeline.
Visitor statistics: Breaks down total visits, unique visitors, last 24h visitors, and returning visitors. Tracking "Returning visitors" highlights deep consideration and interest; when anonymous contacts return multiple times, it indicates they are highly interested but evaluating your offer, showing you who is on the verge of converting.
Lead statistics: Displays the total number of contacts captured by this specific page. This indicates the direct pipeline growth generated by this asset, showing exactly how many prospects your sales team can now engage.
Total conversions: Displays the precise conversion percentage for this page alone, highlighting how effectively this exact layout works compared to your other digital assets.
Total number of visits: A day-by-day chart visualizing your traffic spikes. This highlights the exact moments your audience was most active, allowing you to see which day-of-the-week promotions perform best.
Preview: A quick visual layout check of your live landing page, allowing you to confirm exactly what your contacts see.
Your team can apply the time period filter at the top of this view to isolate specific campaign windows for closer analysis.
The "Visitors" tab lists every single individual who landed on your page. It displays their clickable name, email, phone number, and information on when they were first and last seen. This shows you exactly who is exploring your pages (even before they fill out a form) giving you a clear picture of your traffic quality. Clicking a name takes you directly to that contact's profile.
The "Leads" tab isolates the exact group of contacts who successfully filled out a form on this specific landing page. This provides your team with a clean, actionable list of interested prospects along with their personal details, making it incredibly easy for your sales or marketing teams to run immediate, targeted outreach, as you can add them to the list or assign a tag via the “Manage” button in top right corner.
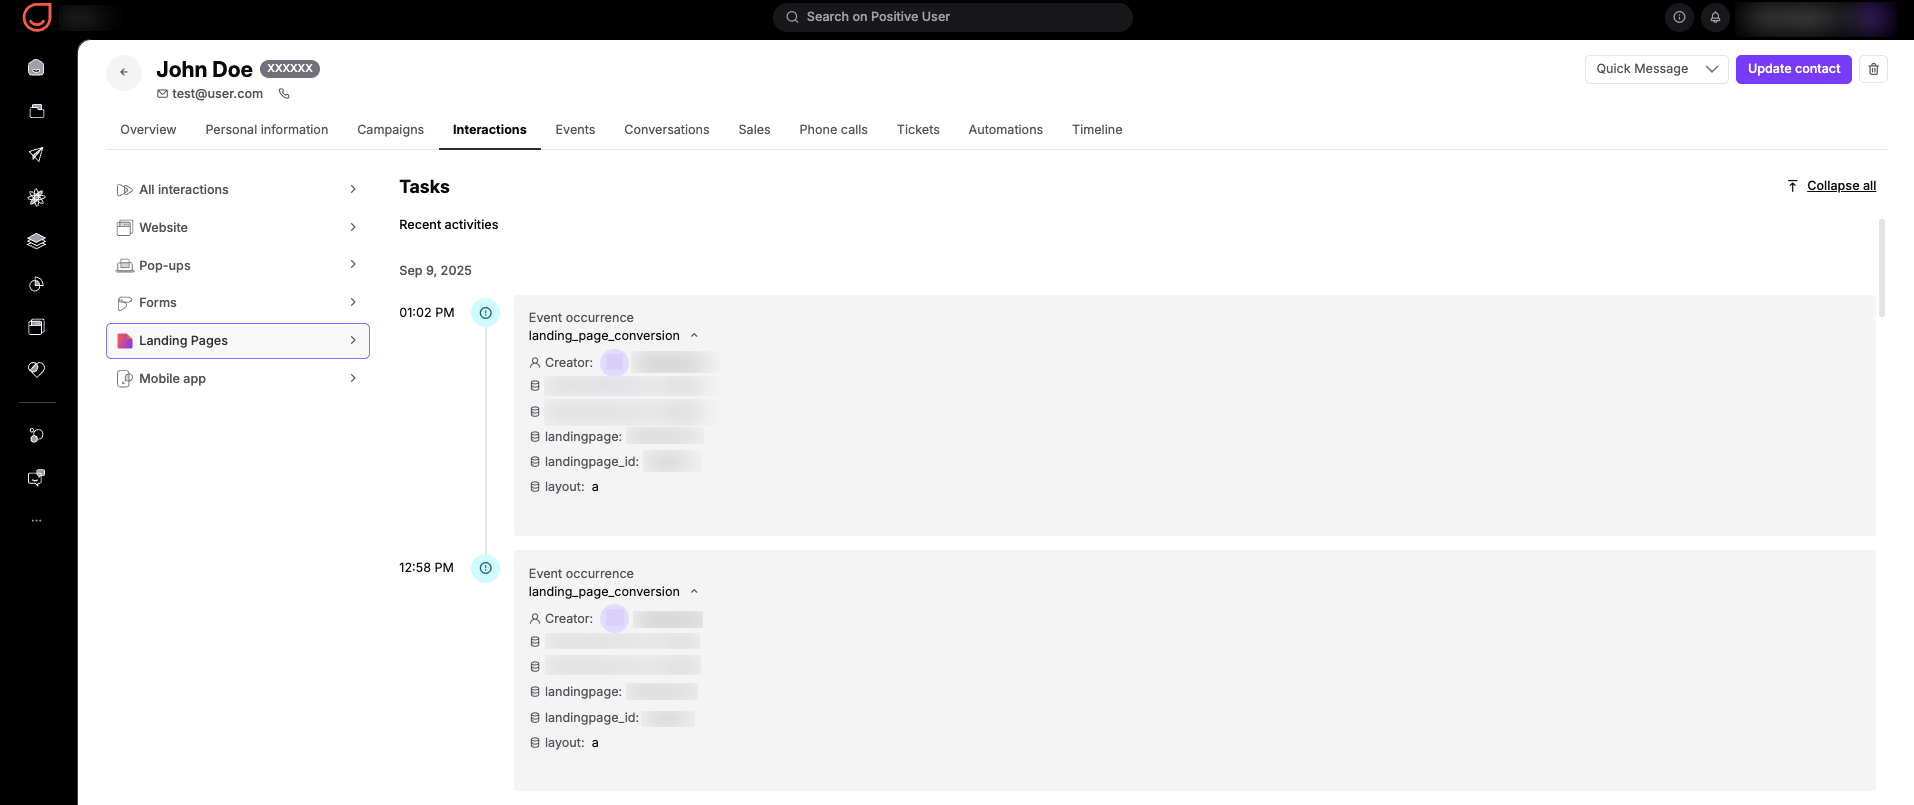
Apart from high-level trends, Positive User allows your team to analyze personal histories to see exactly how a single person interacts with your pages over time. Go to "Contacts", open an individual contact's profile, enter the "Interactions" tab, and select "Landing Pages".
This view unlocks a personal history of this specific contact with your different landing pages. Here, you can find specific landing page conversion events along with all the personal details left by the contact in your forms. Your team can use this granular data to:
Personalize sales outreach: See exactly which product, guide, or offer a prospect signed up for before your sales team jumps on a call with them, allowing for a highly tailored conversation.
Refine lead scoring: Track how many different landing pages a contact has interacted with to highlight how close they are to making a purchase.
Tailor future messaging: Use the specific topics they showed interest in to place them into highly relevant automated email flows.
Lead Generation Automations: Use landing page conversion events to trigger instant email workflows that send welcome emails or deliver requested resources as soon as a contact submits a form.
Campaign Channel Optimization: Filter landing page performance by date range to evaluate traffic spikes and conversions during specific ad runs, helping your team reallocate budget to the highest-performing marketing channels.
Sales Call Context: Review an individual contact's landing page conversion history before a call to understand their specific interests and tailor your pitch accordingly.