Automation logs and statistics provide a clear window into how your active, deactivated, and draft automated journeys perform in Positive User. These tools show you both the high-level health of your automation strategies and the granular, step-by-step progress of individual contacts through your workflows.
Monitor system speeds: Review individual module loading times in milliseconds to verify your workflows operate efficiently.
Maintain historical records: Export detailed records to keep a secure backup before older technical data is removed.
Analyze campaign performance: View compiled data on triggered actions and messages to evaluate your overall marketing impact.
Pinpoint logic errors: Discover exactly where contacts halt in a journey to fix broken conditions or modules quickly.
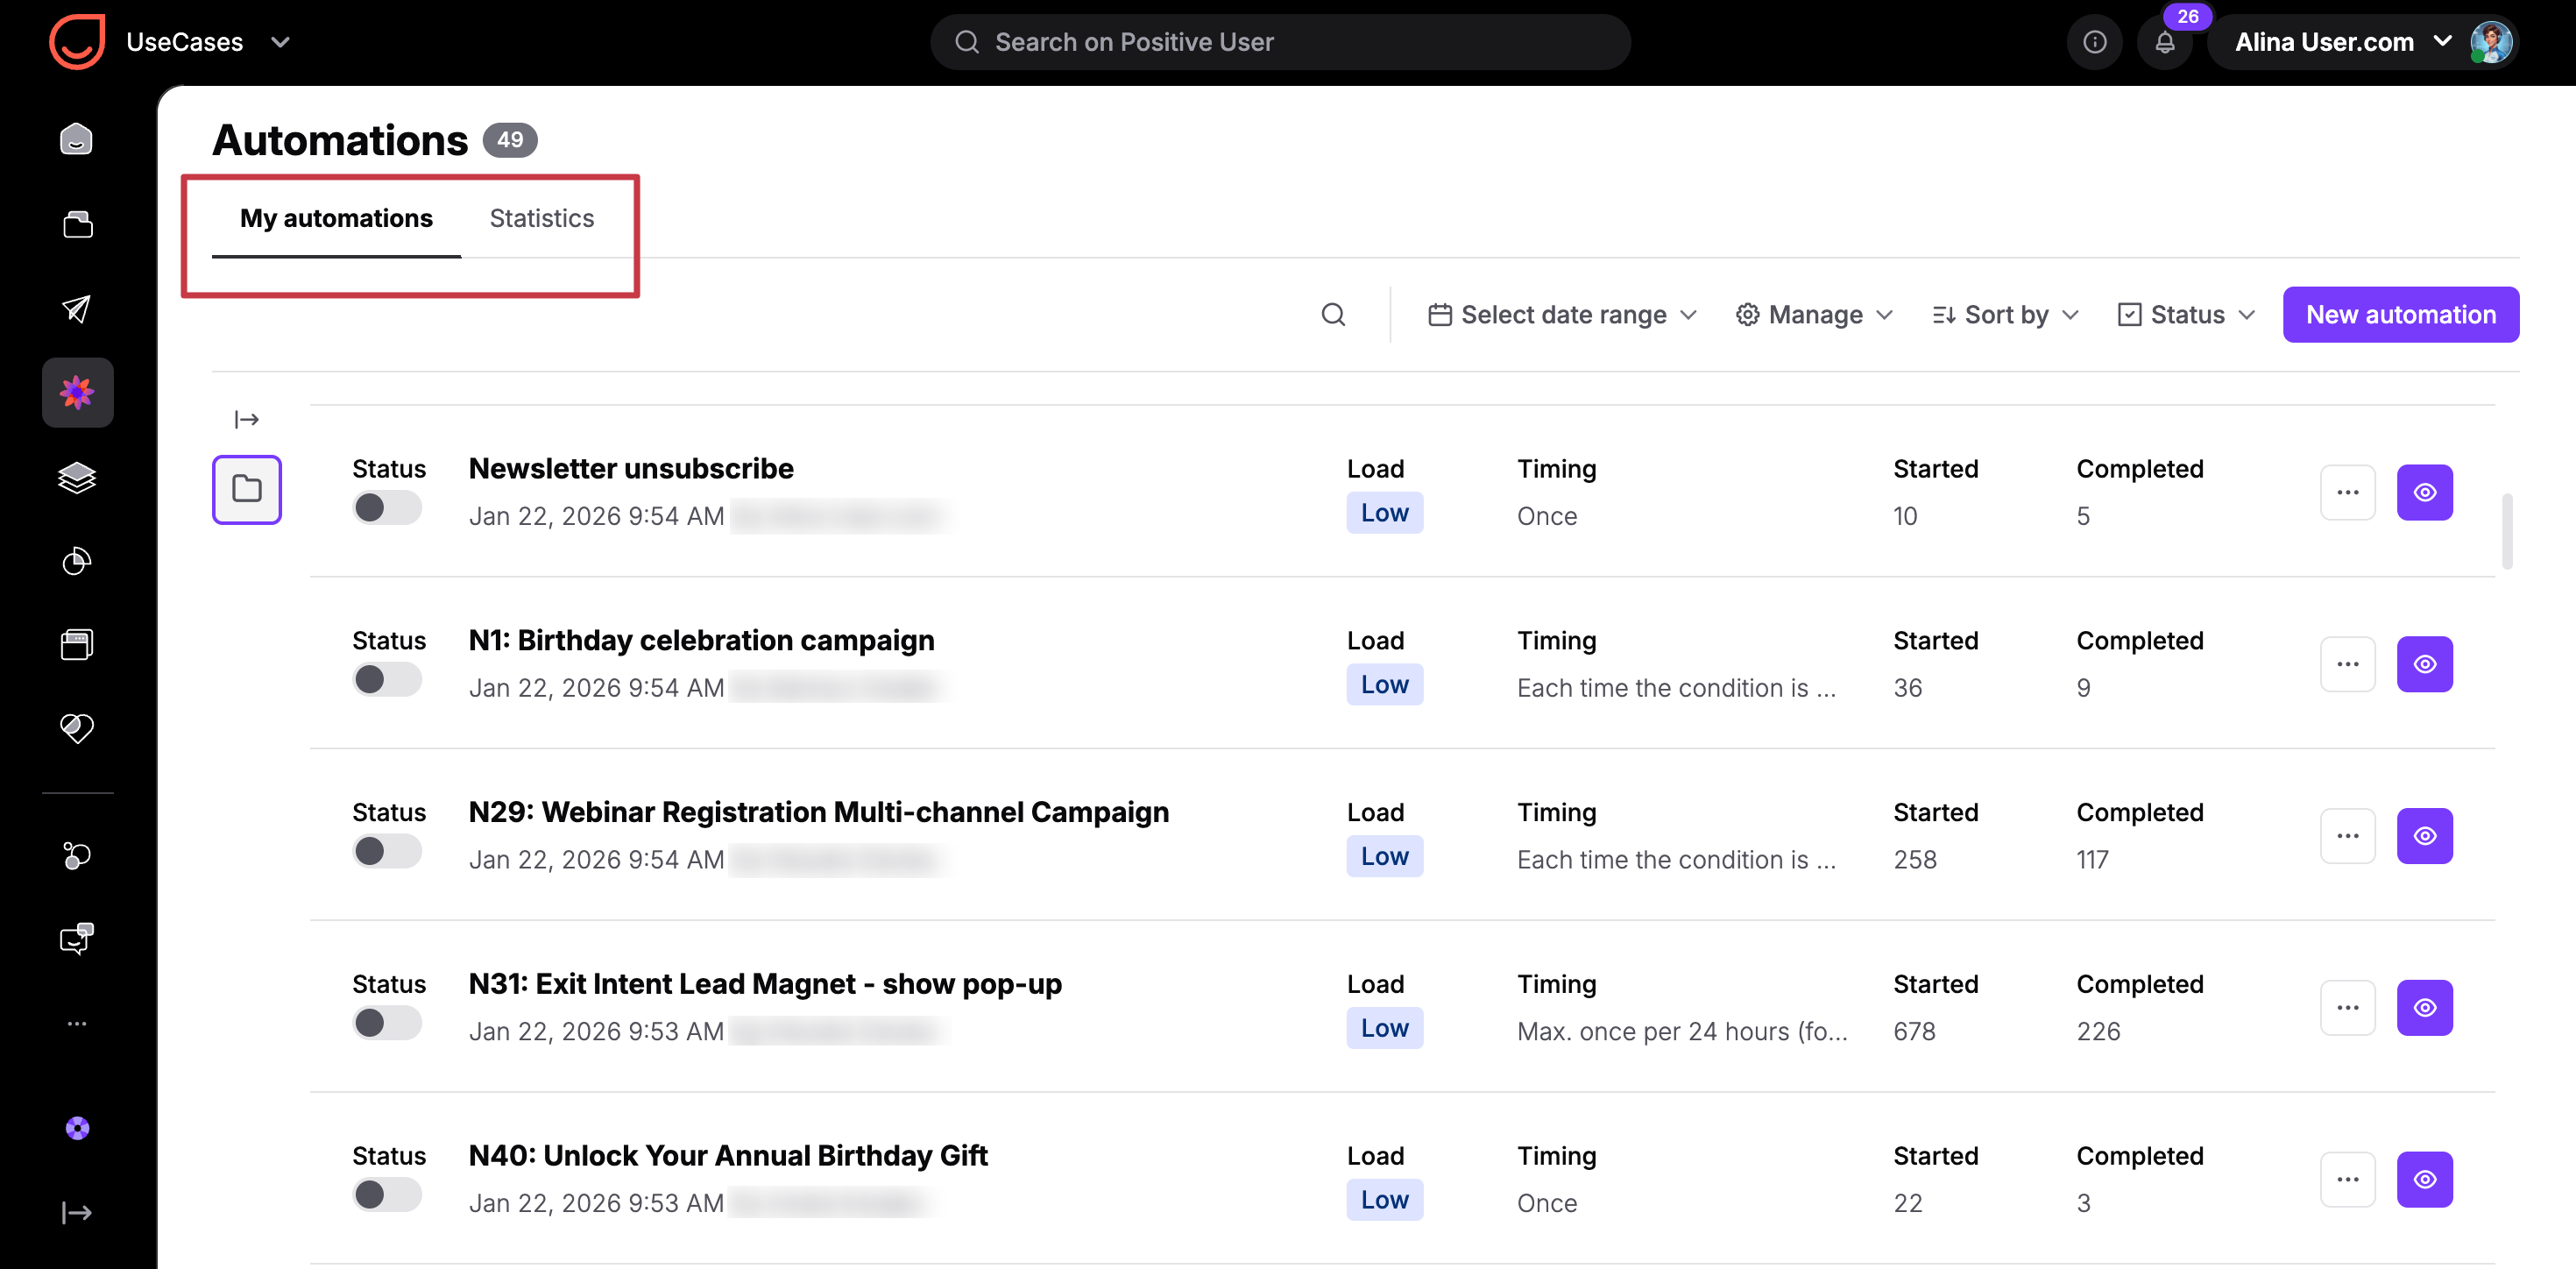
When you navigate to the "Automations" section, you will see two primary tabs: "My automations" and "Statistics".
Under the "My automations" tab, you can view all your created automated journeys. This view features two vital metric columns: "Started" and "Completed".
The "Started" column keeps track of the total number of modules triggered. For example, if a journey contains a trigger and an action module, one contact moving through the whole flow sets the count to two. If six contacts enter the flow, the count updates to six.
The "Completed" column counts the contacts who successfully make it to your final destination module “Finish Path”. This number updates only if you actively include a tracking step at the very end of your build.

To dig into technical steps, click the three dots icon next to any journey name and select "Go to automation logs".
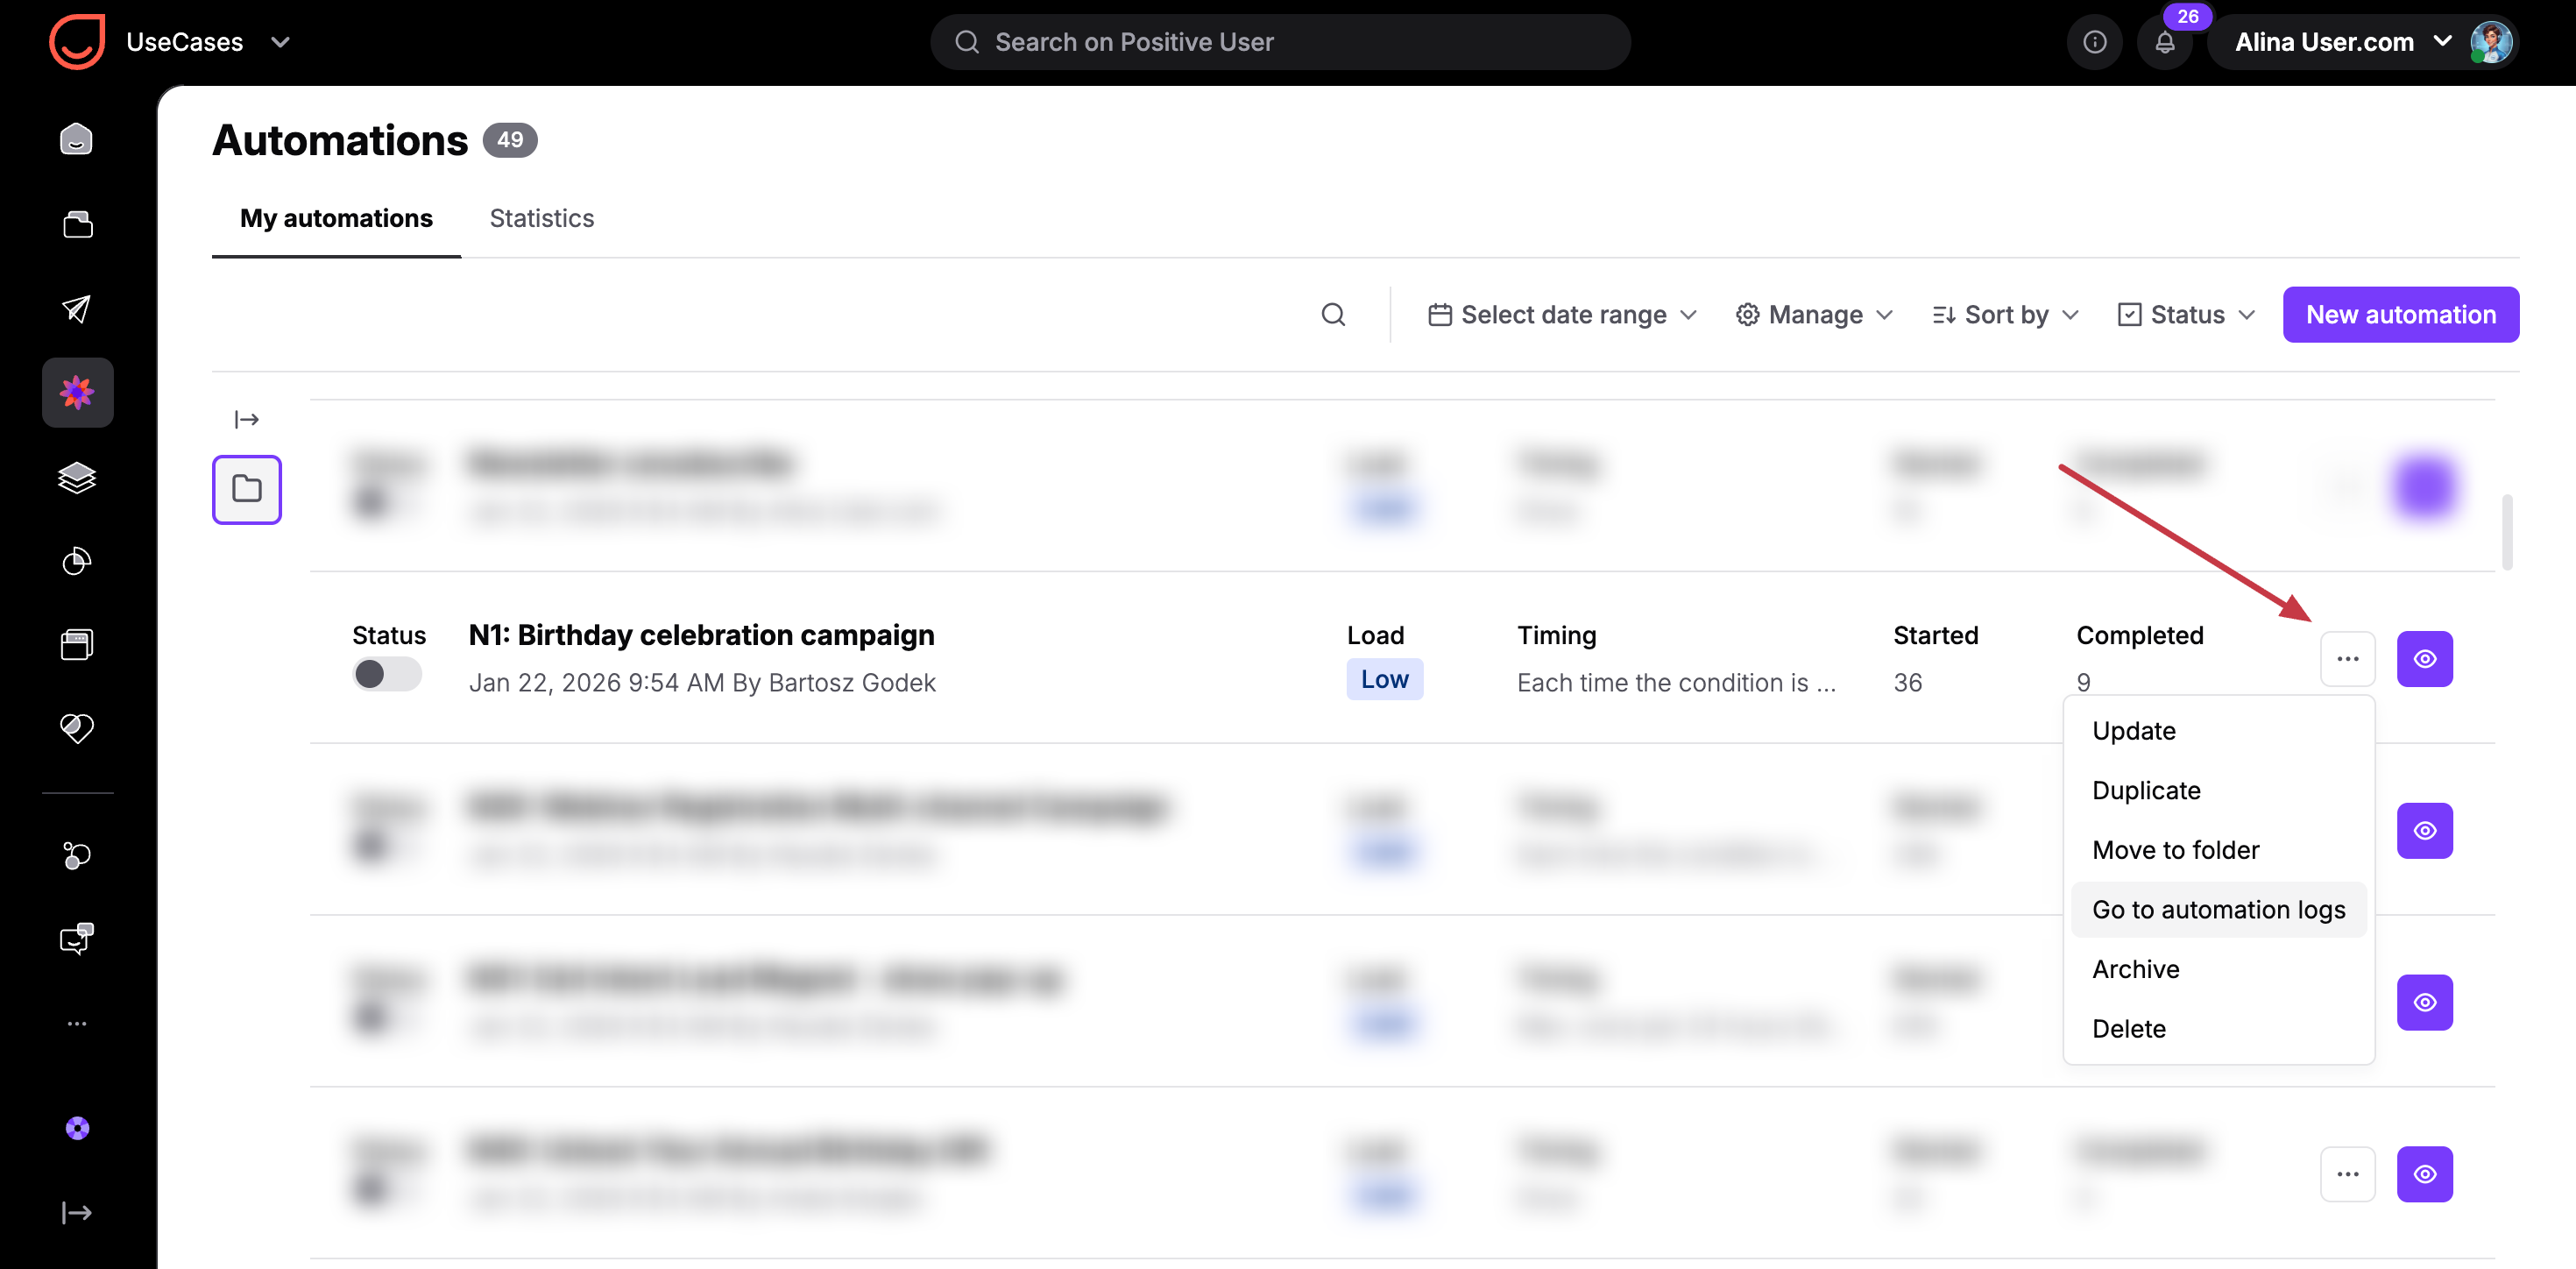
The system opens the "Automation logs" page, where it stores detailed technical records for 30 days. This log reveals specific details about each step: the individual module name, broader automation information, the exact timestamp, contact data, and how fast the module loaded in milliseconds.
You can sort by these individual parameters or filter the history for a specific date range. If you need to keep data older than 30 days, click the "Export" button to create a downloadable backup file.
Automation logs help with the troubleshooting, if your automation is not performing the way you expected it to. Enter the section to review the exact step where your contacts stop advancing. This structural log usually highlights a conflict or logic error in that specific module's setup. Once you identify the broken step, you can adjust the configuration yourself or contact support with the exact log details for faster troubleshooting help.
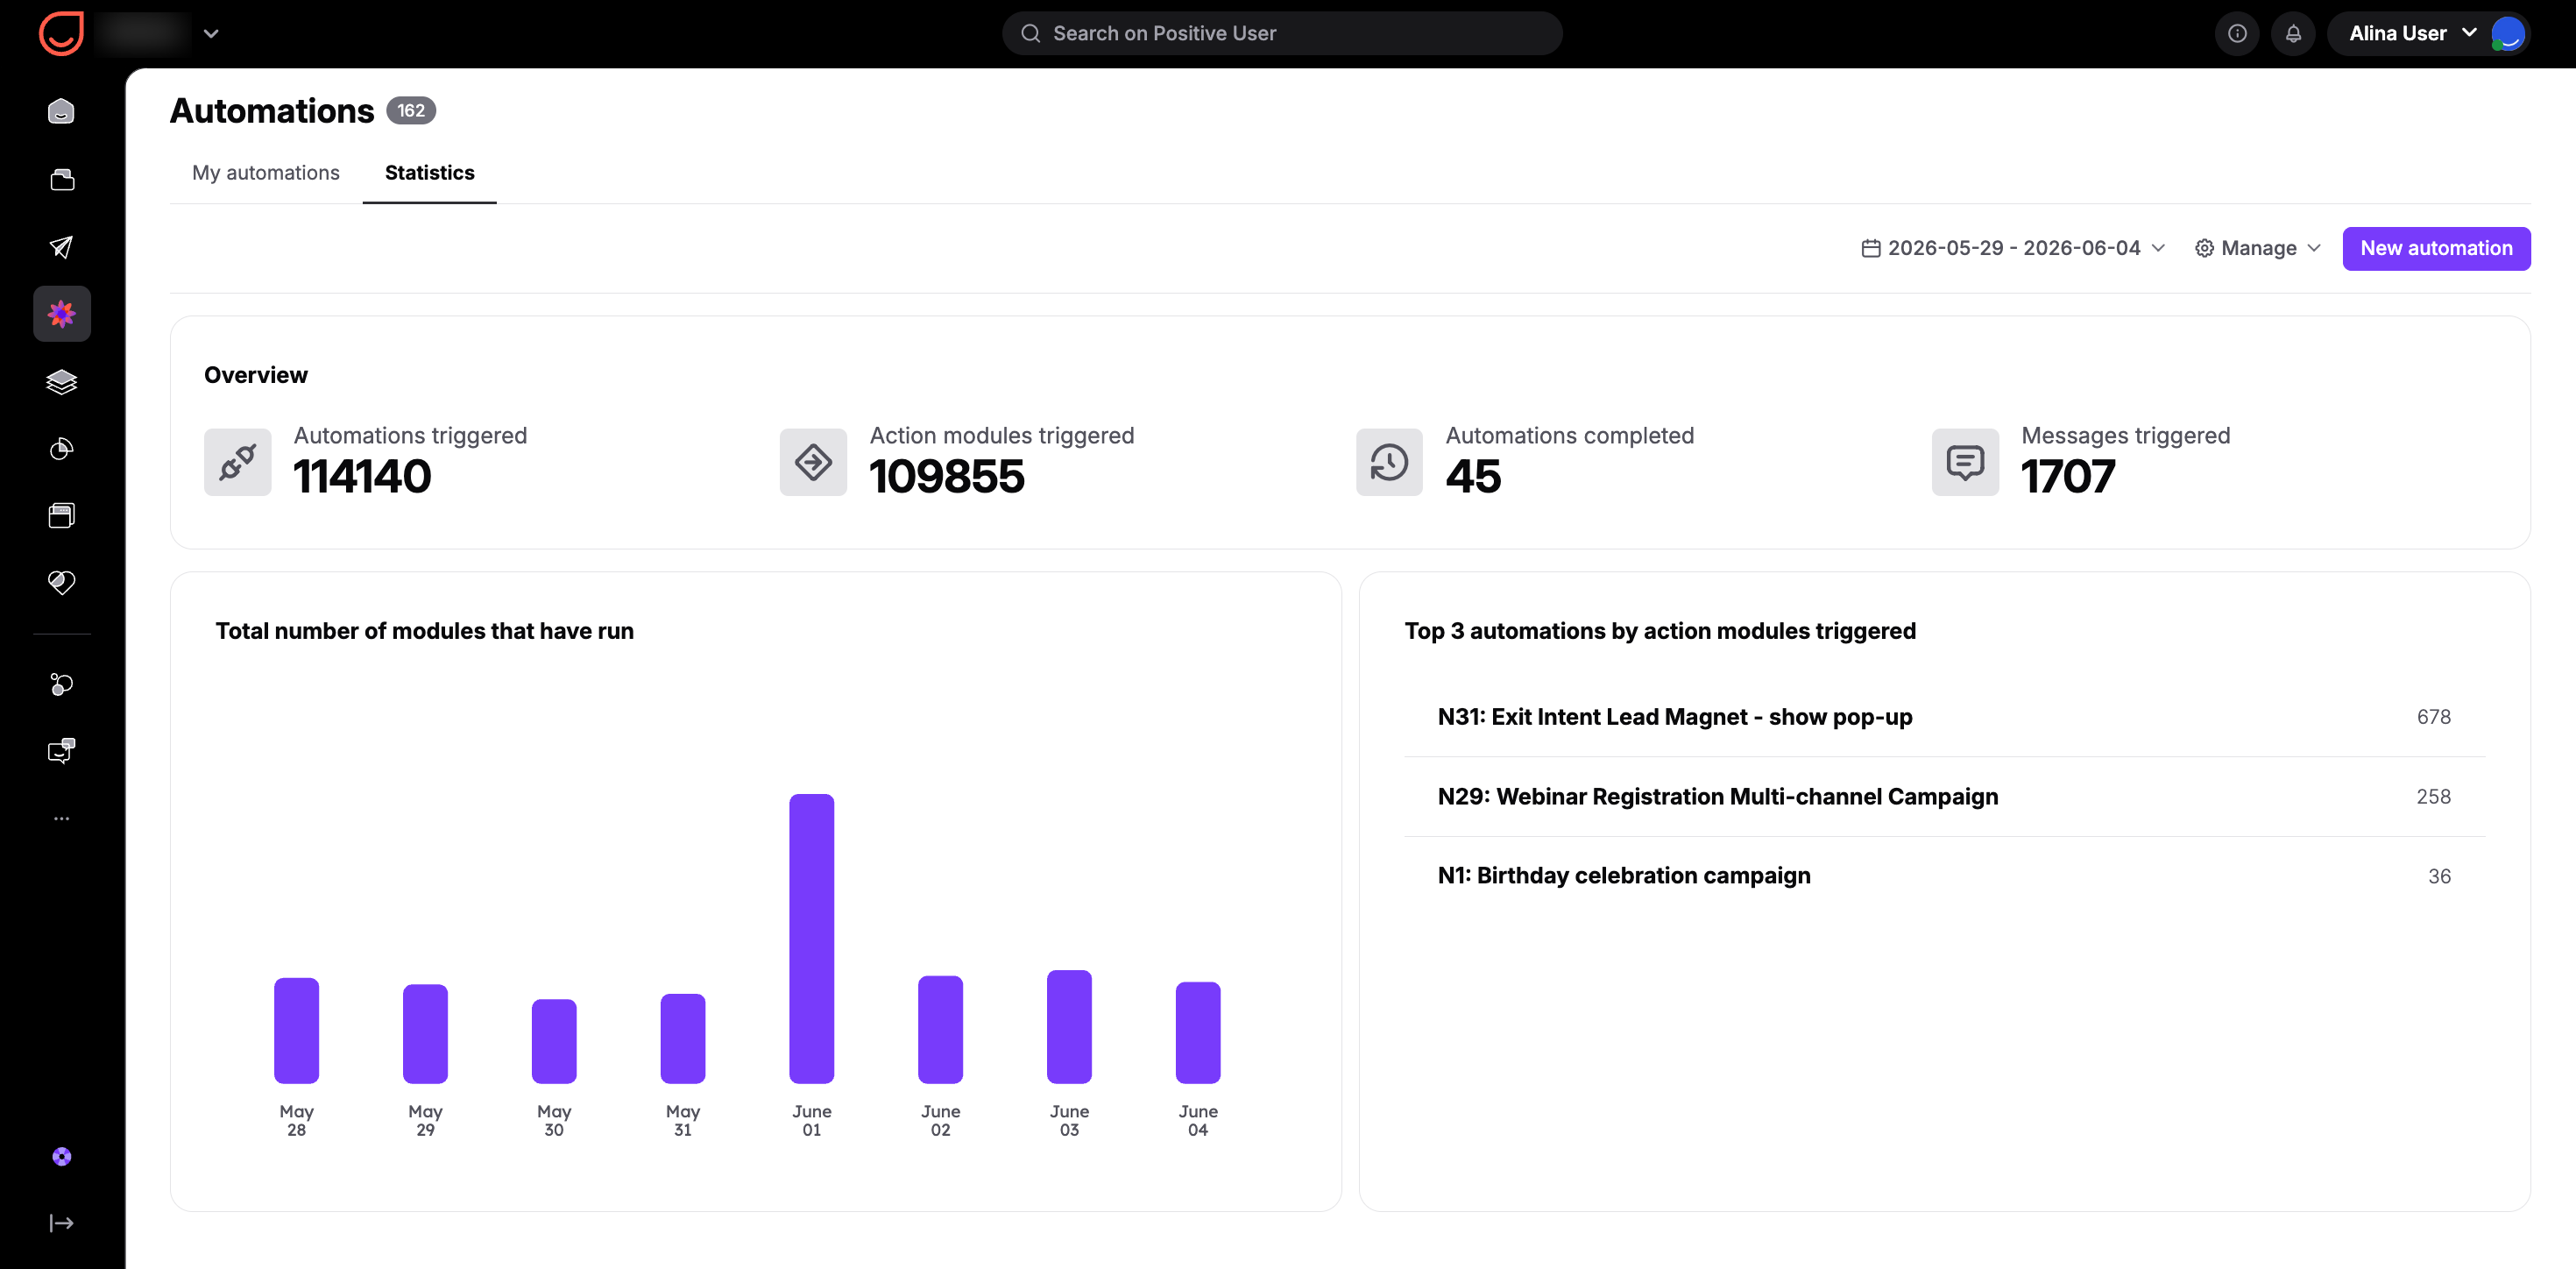
From the “Automations” section you can witch to the "Statistics" tab to view general widgets that summarize your ongoing marketing performance across your workspace.
The "Overview" section displays several high-level numbers: the number of automations triggered, the total number of automations completed (based on your "Finish Path" modules), the count of action modules triggered, and your total triggered messages.
Below this overview, you can review a day-by-day column chart displaying the total number of modules that have run, alongside a list of the top three automations by action modules triggered to show your most active configurations.
These dashboard details automatically update once every day. However, you can filter by a custom date range or manually select the option to update the statistics instantly.