When managing your marketing, sales and support campaigns, keeping track of everything from email performance to team assignments can feel scattered. Dashboards bring your most important data into a single view, giving your team a clear look at how your business processes are running.
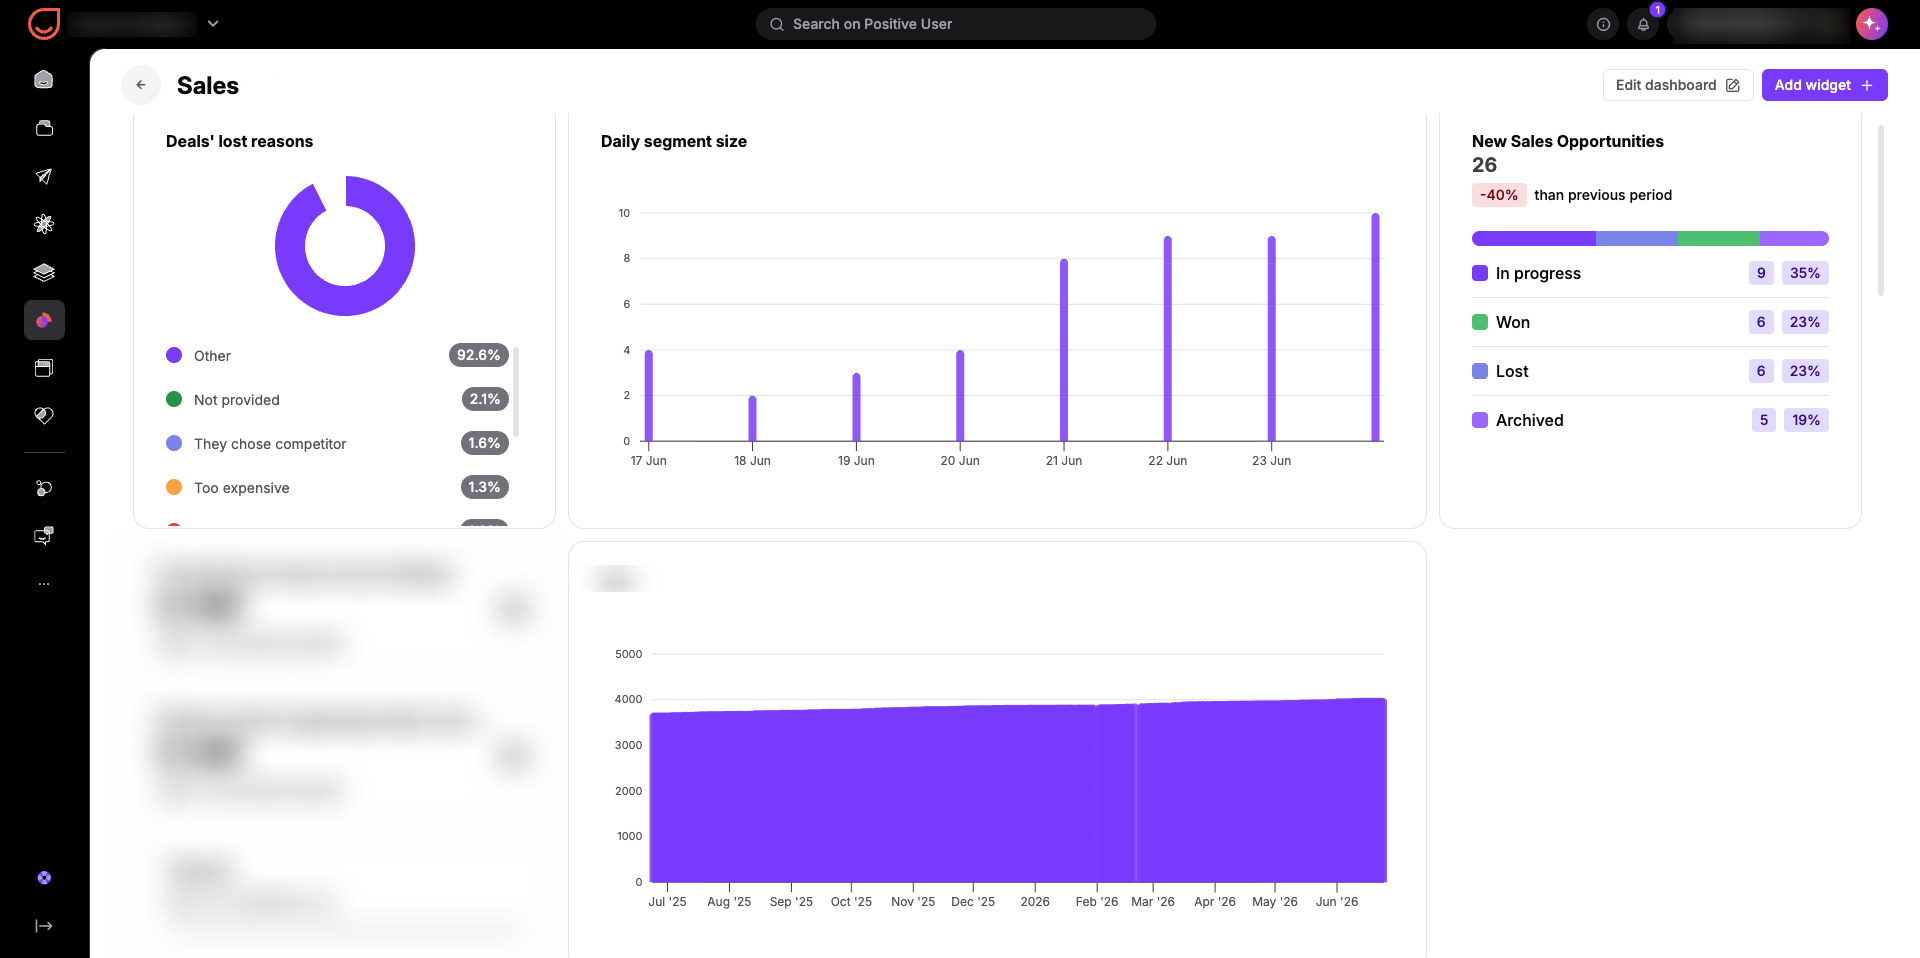
A dashboard is a customizable workspace where you group visual data cards, known as widgets, around a specific theme. Located directly in the main navigation menu of Positive User (“Analytics” section), dashboards serve as the core of your account analytics. Instead of digging through different sections, your team can build distinct dashboards to monitor specific goals, business processes, or department milestones.
Centralize your insights: Group related metrics into dedicated views so your team can see high-level trends at a glance.
Streamline department tracking: Create separate dashboards for different teams or operational goals to keep everyone aligned on their specific targets.
Simplify data review: View performance cards across various object types without constantly navigating to different parts of the application.
To keep your insights organized, you can customize what each dashboard displays by choosing widgets from specific categories. When configuring a dashboard, you select an object type from a dropdown menu to instantly see all relevant widgets available for that topic.
You can organize your dashboards using widgets from all key categories of objects. You can group these dropdown objects to customize your dashboard layouts:
Messaging and Campaigns (Emails, mobile push, web push): Track how well your campaigns reach your audience and view real-time engagement rates.
Cross-Object Attributes and Tracking (Tags segments, events): Monitor custom tags, defined segments, and background events. Because these parameters are flexible, they can track behavioral data and categorizations across multiple distinct objects in your workspace, such as contacts, companies, or deals.
Audience Data (Contacts, lists): Monitor contact growth, and see how your audience splits into different lists.
Automation and Triggers (Automations, events, forms): Watch how your automated customer journeys perform, track form submissions, and monitor custom event actions.
Team Performance (Tasks, conversations): Monitor how quickly team members respond to customer messages and track the completion of daily tasks.
Sales Tracking (Deals, tasks): Keep an eye on your ongoing sales pipelines and review revenue progress.
Advanced Metrics (Calculated attributes, global variables): Display custom calculated metrics and high-level variable values unique to your account business rules.
Content and Experience (Landing pages, knowledge base): Review visit counts on your pages and track how your self-service help articles are performing.
Grouping your widgets helps you track daily operations and long-term milestones clearly.
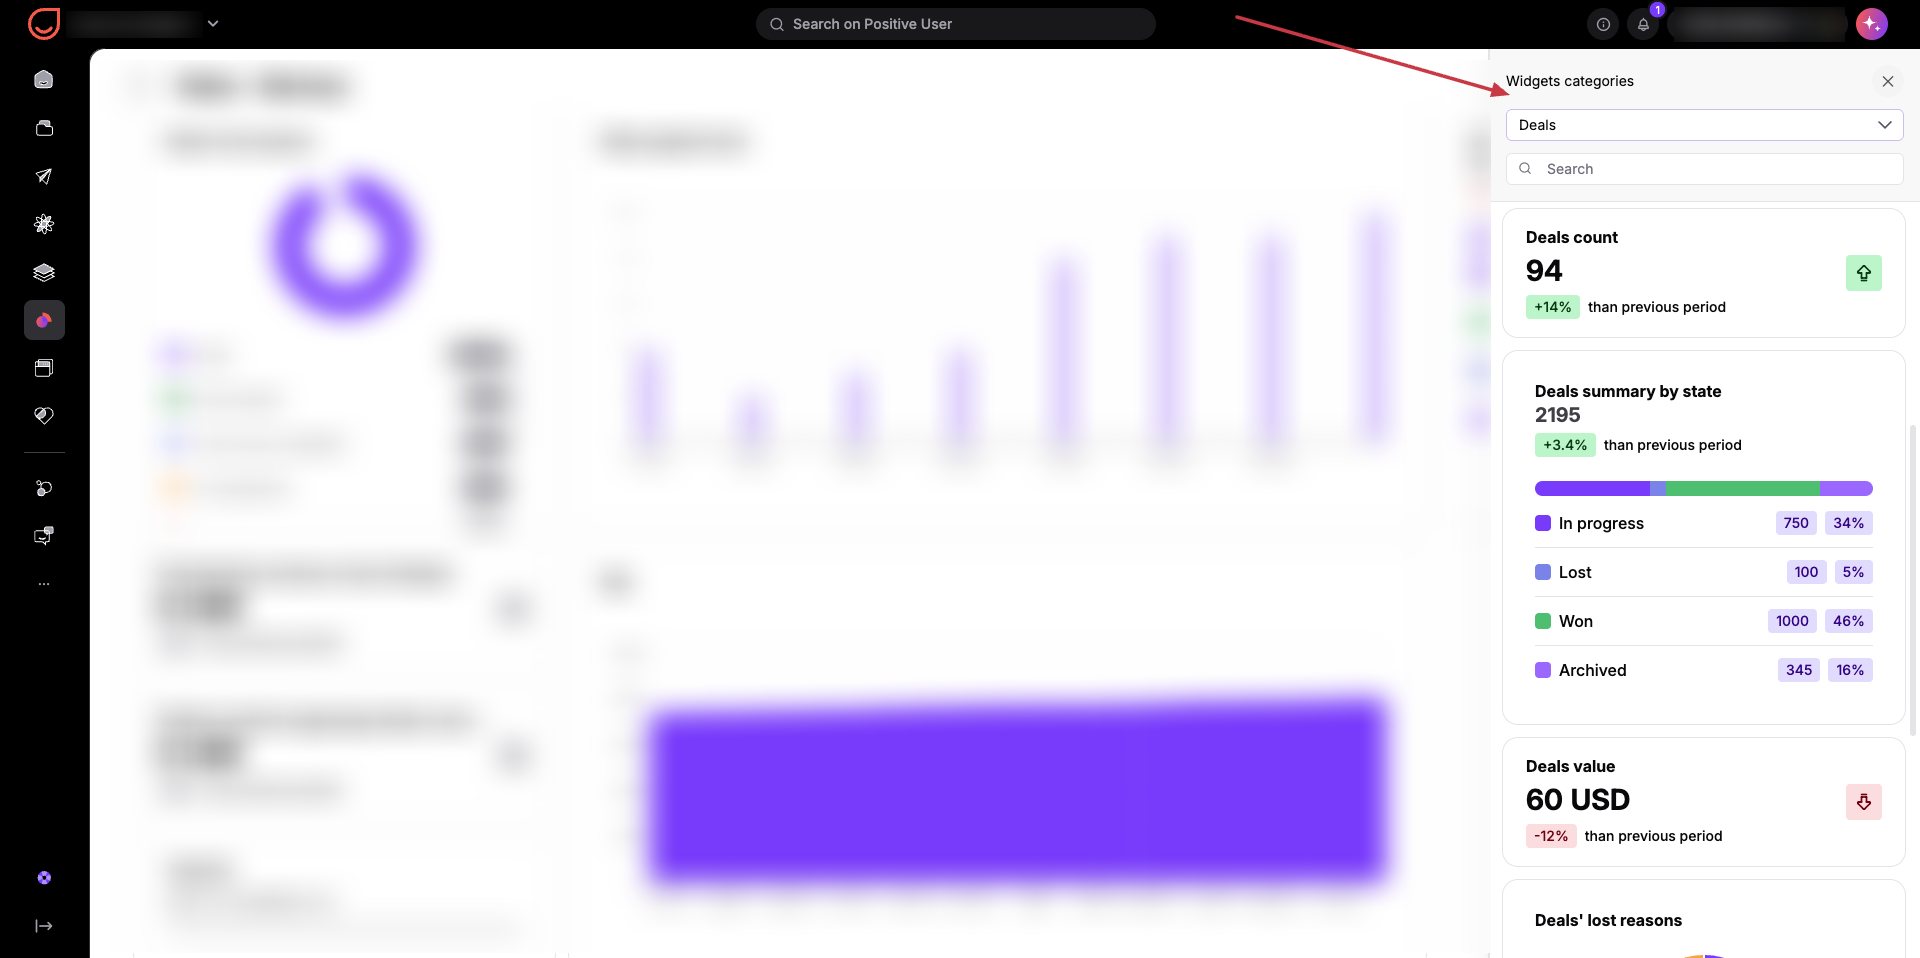
Dashboards function as an interactive canvas where you pull in data from across your entire account. To start building a view, navigate to the "Dashboards" section and click the "Create dashboard" button in the top-right corner.
Once inside a dashboard, select an object category from the sidebar dropdown menu to see a list of widgets available for that specific type. Click on any available widget to choose it, and then configure its individual parameters to add the finished card to your layout.
Team Performance Tracking: Set up a dedicated operational dashboard combining widgets from the "Conversations" and "Tasks" categories. This allows a team manager to monitor response times and open assignments side by side without checking separate logs.
Marketing Campaign Monitoring: Build a marketing-focused dashboard that displays "Emails" performance data right alongside new contact acquisition metrics. This helps a marketing specialist see if recent broadcast efforts are successfully driving audience growth and engagement.
